Ricky Moorhouse
Projects
Photos
Travel
About
☵
Monitoring
9 Nov 2020
technical
Ricky Moorhouse
Monitoring API Connect - 2020 update
2 Jun 2020
technical
Ricky Moorhouse
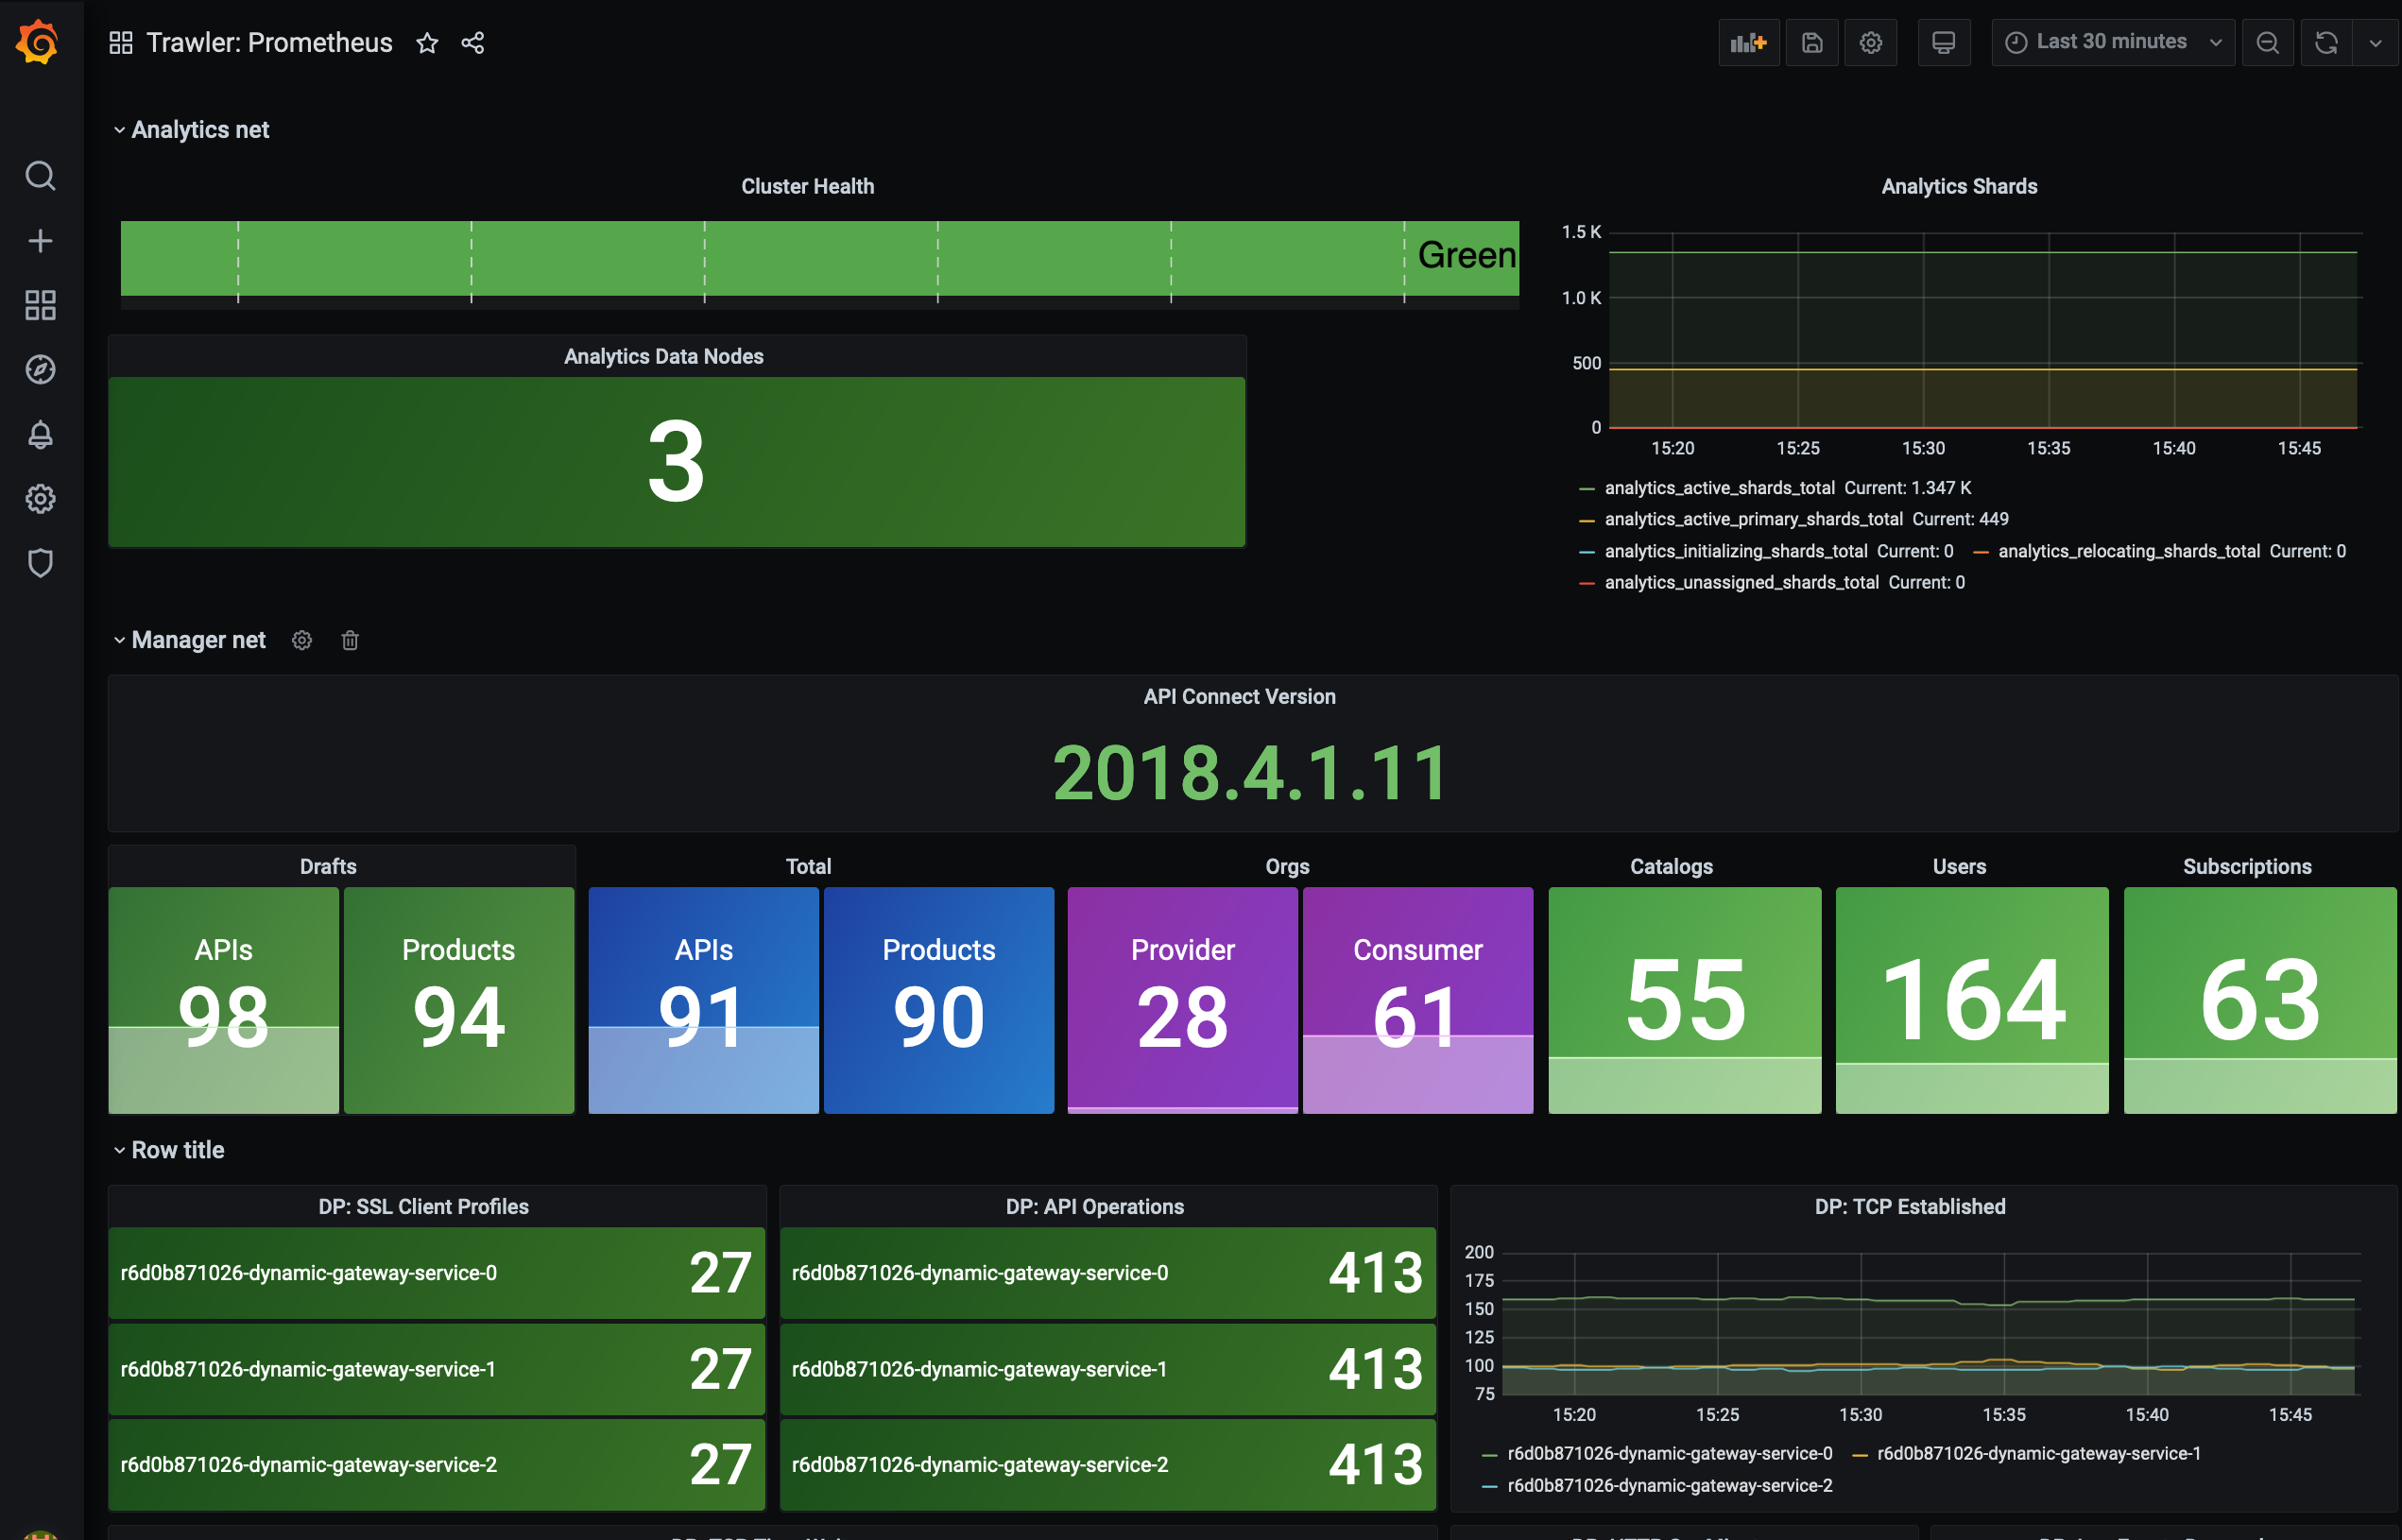
Trawler - Metric gathering for API Connect
25 Apr 2018
Ricky Moorhouse
Introducing hem