Introducing hem
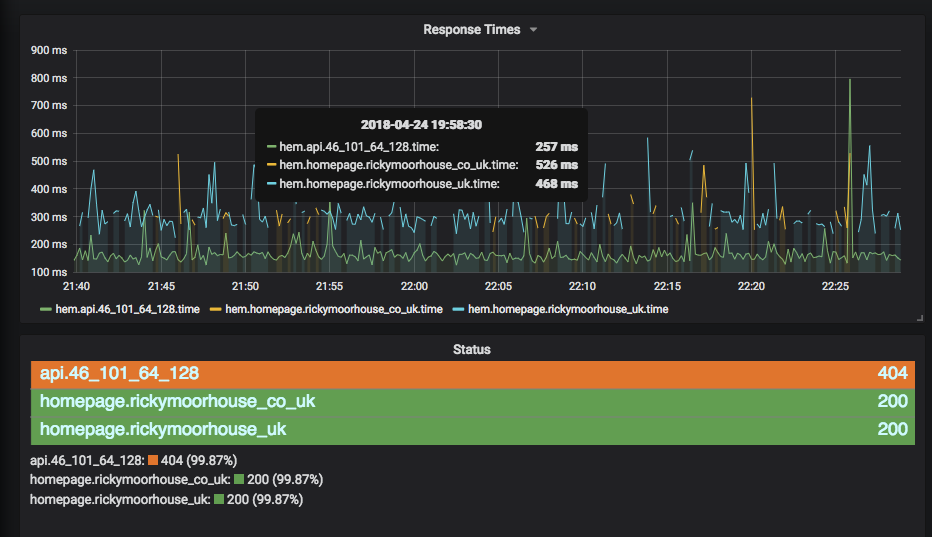
hem is a synthetic monitoring tool which monitors HTTP resources on a regular schedule, storing details of the time taken and the reponse code returned.
I've been using Uptime at work for a while for endpoint monitoring and over the time we've been using it made a few tweaks or plugins for it - in particular being able to send metrics from Uptime to Graphite. There were also some more substantial changes we were considering making and we'd built up a number of supporting scripts to populate the checks via the Uptime API when hosts changed. We also have all our other monitoring dashboards in Grafana. In this context I decided that what would be nice is a simple tool that could replace the checking piece and feed that data into our graphite data store to be viewed and alerted on from Grafana.
hem runs from a simple config file with three main sections in it - discovery, tests and metrics. Both discovery and metrics have been designed as pluggable to give hem versatility - so far I've built discovery drivers for dns, consul and json/yaml and metrics drivers for graphite, kafka and the console. hem will iterate over the tests on a custom interval performing discovery each time to ensure it has the latest list of hosts for that test.
Getting started with hem
To start using hem, you can install it from PyPI with pip:
pip install hemApp
Then create a config file - it will look something like this:
    discovery:
      type: dns
    metrics:
      type: graphite
      server: 127.0.0.1
      port: 2003
    tests:
      homepage:
        path: /index.html
        secure: false
        hosts:
           - example.com
           - example.org
Run hem and start to see metrics flowing to graphite
hem -c config.yaml
In grafana I have the Discrete plugin installed to give the coloured bar look you see above.