Ricky Moorhouse

Blog

Designing for Multi-Region API Deployments

The requirement to be multi-region usually comes suddenly, an immediate business demand, a compliance deadline, or the aftermath of an incident. When designing API Connect SaaS, the decision was to build each region completely independently. Within a region it's highly available across availability zones, but the regions themselves don't replicate. The reasoning is straightforward: as a shared API management platform serving customers with fundamentally different requirements - data residency, cross-region resilience, or both - independent regions let each customer build the topology that fits their constraints, rather than the platform prescribing one.

image

What is your requirement anyway?

The first thing to consider when designing a multi-region API deployment is to make sure you are clear on what the fundamental business requirement is that is driving you towards a multi-region strategy. There are a number of routes that lead towards multi-region planning and they will all drive different variations to the design.

  • Latency - ensuring your APIs respond quickly from the regions you have consumers calling them
  • Resilience - providing a failover for if there are issues in one region.
  • Compliance - ensuring data and/or traffic to remain in a particular region

For improved latency across regions - is this required primarily around read APIs or do you need to handle write operations as well? If it is primarily reads, then you may be able to reduce your latency with the use of a CDN with edge caching without the complexity and cost of a full multi-region deployment.

If you're looking for resilience, will your requirements be satisfied with a primary region that normally will handle everything and a secondary location that can pick things up if the primary is down or do you need them both to be able to handle traffic in parallel? How long can you cope with a failover between regions taking - seconds or hours? These are the factors that will drive how you go about implementing a multi-region solution.

An API is only as good as its data

Whilst it is relatively easy to replicate API Gateways and application servers between regions - this only gets you so far, as at the end of the day the API depends on a data source. Where does the data for your API reside - what requirements for data storage need to be factored into the overall architecture?

If you have an API that is read-heavy and the data is not time critical you may be able to use replication with eventual consistency saving on the performance hit, cost and complexity of ensuring strong consistency between replicas.

If you have a write heavy API - how will you handle conflicts between writes across regions - will you need to add application or data level locking or would you enforce some form of queuing?

To improve performance across regions the other approach could be to have regional caching to reduce the need to retrieve data from the master source, but this will require careful management of time to live values for cached data so that it remains within an acceptable freshness threshold which will differ between data types.

Auth dependencies are the hidden failure mode

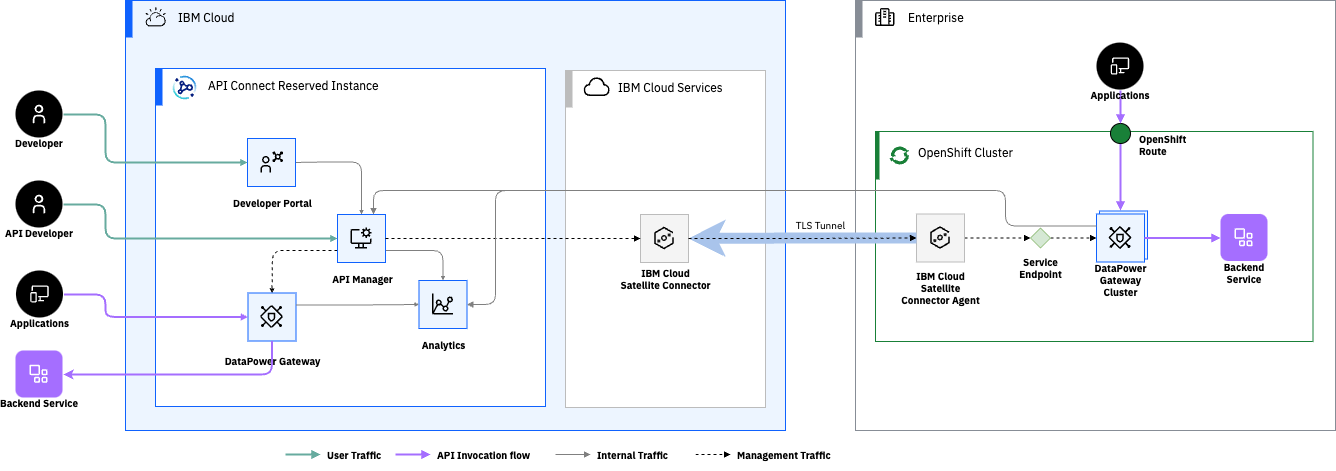
If your identity provider or authorization service is centralised then a regional API failure may be the least of your worries if auth itself is unavailable. API Connect SaaS uses IBMID for it's management plane identity provider, highly available in it's own right, but not part of our regional deployment. Importantly though it's not involved in runtime authentication for customer APIs or their developer portals so any failure doesn't cascade to impact live traffic.

If you can validate JWTs locally without needing to call out to a central service then in most cases you are good, but what happens if you need to revoke a token - do you have a robust system for sharing a revocation list?

How are you handling rate-limiting - is this maintained within the region or do you have a way to track usage across the regions? Within DataPower API Gateway the rate-limiting is maintained through the peering group, requiring a low-latency connection to keep them in-sync. For the DataPower Nano Gateway this can be externalised to your own Valkey or Redis deployment which you could deploy using cross-region replication. Whatever solution your rate limiting is based around, ensure that the period over which the rate is set aligns with the latency in your replication - for example if the replication may sometimes take more than a second you can't use per second rate limiting and would be better to calculate the equivalent over a larger period.

Routing and traffic management

How do you route traffic through your system - starting from the consumer - do you want to expose the regions to them or should they just continue to use a known endpoint and it just works? If you are maintaining a global endpoint you will need some form of global traffic routing - either DNS-based or some form of load-balancing. If you stick with regional endpoints - how are they discovered by the consumer - are they all just servers listed in the OpenAPI specification? Do you provide guidance to the developers building against your API on how to handle retries and failover across regions?

If there are cases where there is state involved, maybe you need some form of session-stickiness to keep the traffic in the region it starts. The techniques you would use here would completely depend on the type of clients you are building for - if this is pure API clients you would need something client IP based, if it's browser based clients, cookies are an option.

If you have global endpoints what controls the routing or failover to a different region - is this purely based on health-check response, latency based or some intelligence based on the inbound IP address and which region is closest to them? For the stateless common components in our API Connect Reserved Instance console we have them available in each region and use broad GeoIP based routing to try and serve inbound traffic from their nearest endpoint with a failover - GeoIP based routing helps to a degree but IP geo-location isn't always accurate.

Failure modes and failover

If there is an issue with one of the regions, how do you detect it and what happens next? Of course if you have to serve traffic within region it may just be a case of waiting it out.

How do you test the failover? Any failover plan is only any use if it works so it is crucial that you have a way to test this. Ideally you would identify a way simulate a failure and trigger the failover - then you can ensure your observability covers this to show what is happening during a failover. Also worth considering when you look at observability for a multi-region solution is whether you define Service Level Objectives by region or across the solution and how you track these, along with the resilience of your monitoring tooling as well.

Actual failures aren't always as cut and dried as the test however - you may find that a region is only partially impacted or continues to run just without any network connectivity. These are key factors to consider when determining the trigger for failover but also for clarifying the state of the system during the failover and what actions will be needed to move back to normal operation after the failover. It may be that you need to treat a region as completely down even when it isn't so as not to end up with split-brain across the regions data - then restore a backup there in order to return to normal afterwards. This was a fundamental part of how we used to deal with replication in Informix - where if there was a network partition we would find multiple nodes continuing to run as primary and we would need to select which node to reset. This was usually the one with a secondary server still attached, but occasionally there would be workload continuing on the standalone primary and nothing happening in the clustered one. The same principle applies here at a higher level: sometimes the safest recovery path is to treat a degraded region as completely lost and restore cleanly rather than trying to reconcile state.

Are there parts of your system that need to be disabled during a regional failure and run in a degraded mode as they add more risk or aren't as crucial to maintain availability on?

Most multi-region requirements aren't as simple as just adding another geographic location - there is a lot more to think through across the different layers of your system - data, auth, routing and how it actually will handle failures. Going back to where we started, the right answer will depend on the requirement you are building for. Latency, resilience and compliance will each take you in different directions as you design so it is key to have clarity up-front rather than trying to do everything and over-engineering a solution. For more on designing with reliability in mind from the start see SRE Mindset in API Architecture or for an example of how this could be done see my post on building a global deployment with API Connect.

The SRE Mindset in API Architecture

image

I spent a good chunk of my career working in SRE and then when the opportunity came up I took the decision to move over into an Architecture role - in some ways a change and in many ways a wider remit to continue with the types of things I'd been doing and working on in the SRE team.

How SRE reliability principles shape architecture

Core principles from my time in SRE have definitely shaped the way I look at bringing our product to the cloud - and whilst there's still a lot of things that I (and our SRE team) wish we had done better with, I think it's a valuable insight to have when building out these systems. I think the biggest area this has influenced my way of working is a desire to be driven by real data where possible and validate my thinking with what we are seeing in reality.

Sizing - planning for reality, not hopes

When we're building something new we often get the numbers wrong - either we're too optimistic and expect viral exponential growth or we're too pessimistic and assume no-one is interested. If however you're building something that you have experience with either directly or in a similar area there is real data available to reference.

This means you can inform your sizing estimations with a grounding in historic real world usage data. It won't always be precise and these things usually don't repeat in the same way but at least it means you are learning from something and building on the lived experience.

Even though we can capture some data to base our sizing on we still want to validate it - key to any architecture is testing the decisions you've made - both in small parts and end to end. For load testing I would want to use realistic numbers that can be proportioned against the expectations - so validating each point in the scale up - over a short term to understand the characteristics - then do some additional longer running load tests to ensure things continue to operate over time as you would expect. This also needs to be combined with your observability plan - if you get these in place early you can use them as part of your load testing validation and capture valuable insights into your system.

This then leads into the next set of sizing decisions - how and when do you scale? For each part of your system you need to look at how scaling would apply and the impact this has on the neighbouring components - e.g. if we just scale up the API Gateway to handle more load but haven't ensured we have the right rate limiting or considered the capacity of the backend microservices serving the API we could just be opening ourselves up for too much traffic and different types of failure. At each layer we need to consider how much capacity we need, how long the different scaling strategies would take and the cost implications of allowing this to scale automatically. Some parts of the system may be so critical or growth is directly proportional to your revenue so that an increase in cost with autoscaling may be the desired outcome.

Observability - you can't fix what you can't see

Can you tell what is going on in the system? As systems become more complex and more microservices are added it is fundamental to be able to answer these types of questions about specific areas. Building systems for observability from the start makes it a lot easier than bolting this on afterwards. Defining standard approaches and formats for observability means that you're not deciding for each component independently but you have something that everything in the system can adopt. These need to cover the three main pillars of observability - Metrics, Logs and Traces.

  • Metrics give you a lightweight numeric representation of parts of your system that you can graph over time - they are useful for indicators as to how loaded things are or how slow certain flows are performing. For example, response times, payload sizes and error count
  • Traces let you follow the end to end journey of a request through your system detailing the steps it has taken along the way and connections between microservices and processes. This would show the inbound request from when it hits your API Gateway on to each microservice that is involved in responding to that request - giving you full details of what and when at each stage. In fact your traces are really the living illustration of your architecture.
  • Logs give you insight into the path through your code that is being taken or the error cases you are hitting. Having consistently formatted structured logs with request ids to correlate what request the log relates to or tie it to the trace without guessing.

I read a comment somewhere that diagnosing problems in a microservices architecture is like a murder mystery - however much you like solving these, you don't want to have to at 3am at the end of a pager, so in logging we need to think about this up front.

Metrics will give you an easy snapshot of if there is a problem, Traces will show you which service is causing the problem and the logs will tell you why. These will also have a significant impact on the costing of your solution - metrics being the cheapest and logs being the most expensive as they will scale up rapidly as your volumes increase - 1 transaction could result in 10-100 log lines depending on the complexity and how verbose your logging is. This is also why it is key to be able to dynamically adjust log levels - you can keep the general volume down and increase it as necessary.

As with sizing we mustn't get carried away with the trillions of transactions we're hoping to see on day 1 with 100% uptime - we need to set some expectations (Service Level Objectives) as to what real use of the system needs to look like and what our customers would accept. This is not what the SLA is or what the ideal requirement is (that would be super fast and always available) but the acceptable level of availability and responsiveness day to day. In some scenarios waiting for 5 seconds for data is fine, and others it is needed within milliseconds and each delay costs money. Just like some scenarios can cope with a retry and others can't.

Sizing the system, ensuring we can answer the crucial questions about what is happening in it and appropriately meet our users' expectations are some of the ways my SRE experience has directly fed into my architecture work. Equally important is designing for resilience - ensuring the system can fracefully handle failure rather than just hoping it won't happen. That's one of the next topics I plan to explore here, looking at failure modes and resilience patterns building from what I've covered here.

Building an AI Agent: From Inspiration to Implementation

I've been fascinated by the idea of AI agents for a while now - programs that can not just chat, but actually do things. A few weeks back I came across Clawdbot - now called OpenClaw and it clicked something in my brain. This had a great potential for proactive workflows with a regular trigger to identify things that needed doing and the ability to extend itself with additional code and updates to it's own configuration. Very powerful, but also very risky if not controlled. I set this up intially as it's own user account and then fairly soon moved it into an isolated VM.

I really liked the potential here but wasn't comfortable with the complexity of the code and the power I was giving it or would need to give it to do more interesting tasks - I've still not let it access calendar or e-mail for example. However if I could build something I could read all the code for and understand - with my own selection of controls and tools that are limited according to my own sense of risk level.

So rather than just using someone elses platform I embarked on building something smaller and more personal that I could tune to the things I wanted it to do. This became a great learning experience in understanding the basics at the core of what is needed in an Agent but also how this can get much more complex as you start to deal with things like memory and control.

Why Go?

Python would have been the obvious choice. It's the default language of AI, with libraries for everything, but I wanted to start with API calls rather than libraries and Go offered something different:

  • Single binary deployment - no virtual environments, no dependency hell
  • Straightforward concurrency - agents need to do multiple things at once
  • Static typing - catching mistakes at compile time matters when your agent is taking real actions

The Architecture

The agent follows a pattern you'll recognise if you've looked at OpenClaw or similar frameworks:

  1. Model - The brain. Currently I'm switching between Ollama, MiniMax and Claude all using their Anthropic compatible API
  2. Planner - Takes the user's request and figures out what steps are needed
  3. Executor - Runs the planned steps, handling tool calls and results
  4. Tools - The verbs the agent can use (files, commands, web search, etc.)
User Request → Planner → [Tool Calls] → Executor → Results
                   ↑                         │
                   └────── Feedback ←────────┘

The key insight from OpenClaw that shaped this was deliberate action. The agent doesn't just guess what to do - it reasons about the next step, executes it, observes the result, and decides what to do next. That loop is the heart of it.

The Tool Selection

So far I've created a set of basic tools:

Tool Purpose
read_file / edit_file Working with code and notes
exec_cmd Running shell commands
list_files Exploring directory structures
web_search / web_fetch Research without leaving the terminal
todoist Task list for the agent to work on without always being directly prompted

The interesting part wasn't adding tools - it was deciding what not to add. Every tool is a potential attack surface or a source of confusion. The discipline of a small, thoughtful toolbox is more valuable than a big one.

Lessons from Building It

Context is everything

The agent is only as good as what it knows about the world it's operating in. Early versions missed crucial details because I didn't pass the right context to the model. Now I spend more time thinking about what context to provide than about the tool infrastructure itself.

Tool design matters enormously

Badly designed tools create bad agent behaviour. The model will find the problems with the tools and either hit them multiple times causing more to clean up or work around them in interesting new ways. A tool that returns too much information overwhelms the context. Too little, and the agent is flying blind. The best tools do one thing well and return structured, predictable output. One of the things I found that helped here was when the agent was struggling with the tools - either through bugs or a lack of clarity I had it look at improving them in context so the specific error fed into the solution. An example of this was it kept trying to use the exec tool to write new files and hitting issues as my protections were blocking multi-line pipes, where as I'd intended this to be done through the edit tool - so asked the agent to improve the description and metadata for the edit tool to make it clear it could be used for this.

Trust but verify

The agent can take actions - that's the point. But it needs guardrails. I've built in permissions and observability so I can see what it's trying to do before it does something irreversible. The goal is helpful, not dangerous.

What's Next

Right now the agent is genuinely useful for my workflow. It writes drafts, fetches information, organises files, and saves me clicks. But there's more to do:

  • Memory - I'm storing memory in markdown but want to explore doing something better here for easier retrieval
  • Multi-step tool composition - chaining tools intelligently - often today it feels like there are more steps used than really necessary so seeing potential for optimisation
  • Better planning - fewer back-and-forth iterations

The thing I'm most proud of isn't any single feature. It's that it exists, that I built something that actually works, and that it reflects how I think about AI: not as magic, but as a tool. I'll probably share more findings as I experiment more - for now this is working for me as a collaborator on code development (including it's own code base) and a research assistant.

The code lives in a private repo for now as this is intended as a personal agent not a framework, but the concepts here are universal. If you're thinking about building an agent, start small, choose your tools carefully, and remember: the goal is to build something that helps you.

References I found helpful

Global Deployment with API Connect - Serving APIs Worldwide

Why Global API Deployment Matters

If you have customers around the world, serving your APIs from a global footprint significantly improves their experience by reducing latency and increasing reliability. With API Connect's multi-region capabilities, you can ensure users call your APIs from locations closest to them, providing faster response times and better resilience against regional outages.

In this guide, I'll walk through deploying APIs to the 6 current regions of the API Connect Multi-tenant SaaS service on AWS. At the time of writing, these regions are:

  • North America: N. Virginia
  • Europe: Frankfurt, London
  • Asia-Pacific: Sydney, Mumbai, Jakarta

I'll use N. Virginia as the initial source location and demonstrate how to synchronize configuration across all regions.

API Connect Global Deployment

Automatically Deploy APIs and Products to all locations

To maintain consistency across regions, you'll need a reliable deployment pipeline. This pipeline should handle the deployment of APIs and products to all regions whenever changes are made to your source code repository.

You can build this pipeline using either:

This automation ensures that whenever you merge changes to your main branch, your APIs and products are consistently deployed across all regions without manual intervention.

Pipeline Architecture

Create an API Connect instance in each region

Before configuring your global deployment, you'll need to:

  1. Create an API Connect instance in each target region
  2. Use the same configuration as your source location (N. Virginia in this example)
  3. Specify a unique hostname for each regional instance

Pro Tip: Each paid subscription for API Connect SaaS includes up to 3 instances which can be distributed across the available regions as needed. For a truly global footprint covering all 6 regions, you'll need two subscriptions.

Configure the portal for the source location

For developer engagement, you'll need a portal where API consumers can discover and subscribe to your APIs. In my implementation, I chose the new Consumer Catalog for its simplicity and ease of setup.

While I didn't need custom branding for this example, I did enable approval workflows for sign-ups. This allows me to:

  • Review all registration requests
  • Control access to sensitive APIs
  • Manage who can subscribe to which products

Portal Configuration

Configure ConfigSync to push configuration changes to all regions

The key to maintaining consistency across regions is ConfigSync, which pushes configuration changes from your source region to all target regions. Since ConfigSync operates on a source-to-target basis, you'll need to run it for each target region individually.

My implementation uses a bash script that:

  1. Sets the source region (N. Virginia)
  2. Defines common properties for all target regions
  3. Loops through each target region, setting region-specific properties
  4. Runs the ConfigSync tool for each region

Config Sync Architecture

Here's the script I use:

#!/bin/bash

# US East is always the source catalog
export SOURCE_ORG=ibm
export SOURCE_CATALOG=production
export SOURCE_REALM=provider/default-idp-2
export SOURCE_TOOLKIT_CREDENTIALS_CLIENTID=599b7aef-8841-4ee2-88a0-84d49c4d6ff2
export SOURCE_TOOLKIT_CREDENTIALS_CLIENTSECRET=0ea28423-e73b-47d4-b40e-ddb45c48bb0c

# Set the management server URL and retrieve the API key for the source region
export SOURCE_MGMT_SERVER=https://platform-api.us-east-a.apiconnect.automation.ibm.com/api
export SOURCE_ADMIN_APIKEY=$(grep 'us-east-a\:' ~/.apikeys.cfg | awk '{print $2}')


# Set common properties for all targets - in SaaS the toolkit credentials are common across regions.
export TARGET_ORG=ibm
export TARGET_CATALOG=production
export TARGET_REALM=provider/default-idp-2
export TARGET_TOOLKIT_CREDENTIALS_CLIENTID=599b7aef-8841-4ee2-88a0-84d49c4d6ff2
export TARGET_TOOLKIT_CREDENTIALS_CLIENTSECRET=0ea28423-e73b-47d4-b40e-ddb45c48bb0c

# Loop through the other regions to use as sync targets
# Format: eu-west-a (London), eu-central-a (Frankfurt), ap-south-a (Mumbai), 
# ap-southeast-a (Sydney), ap-southeast-b (Jakarta)
stacklist="eu-west-a eu-central-a ap-south-a ap-southeast-a ap-southeast-b"
for stack in $stacklist 
do
    # Set the target management server URL for the current region
    export TARGET_MGMT_SERVER=https://platform-api.$stack.apiconnect.automation.ibm.com/api
    # Retrieve the API key for the current region from the config file
    export TARGET_ADMIN_APIKEY=$(grep "$stack\:" ~/.apikeys.cfg | awk '{print $2}')
    # Run the ConfigSync tool to synchronize configuration from source to target
    ./apic-configsync
done

For managing API keys, I store them in a configuration file at ~/.apikeys.cfg where each line contains a region-key pair in the format region: apikey. This approach keeps sensitive credentials out of the script itself - for a more production ready version this api key handling would be handed off to a secret manager.

Verify that everything works as expected

After setting up your global deployment, it's crucial to verify that everything works correctly across all regions. Follow these steps:

  1. Test the source region first:

    • Register a consumer organization in the portal
    • Subscribe to a product containing an API you want to test
    • Use the "Try now" feature to invoke the API and verify it works
  2. Verify ConfigSync completion:

    • Check logs to ensure the ConfigSync job has completed successfully for each region
    • Verify that all configuration changes have been properly synchronized
  3. Test each target region:

    • Call the same API from each region using the appropriate regional endpoint
    • Verify that response times, behavior, and results are consistent
    • Check analytics to confirm that traffic is being properly recorded in each region
  4. Monitor for any issues:

    • Watch for any synchronization failures or configuration discrepancies
    • Address any region-specific issues that might arise

Possible next steps

Once your global API deployment is working, consider these enhancements:

  • Implement global load balancing to automatically route customers to the closest region based on their location
  • Set up cross-region monitoring to track performance and availability across all regions
  • Implement disaster recovery procedures to handle regional outages gracefully

Conclusion

A global API deployment strategy with API Connect provides significant benefits for organizations with worldwide customers. By following the approach outlined in this guide, you can:

  • Reduce latency for API consumers regardless of their location
  • Improve reliability through geographic redundancy
  • Maintain consistent configuration across all regions
  • Simplify management through automation

While setting up a global footprint requires some initial configuration, the long-term benefits for your API consumers make it well worth the effort.

Product Academy for Teams - San Jose

Last week I had the opportunity to attend the three-day Product Academy for Teams course at the IBM Silicon Valley Lab in San Jose.

This brought together members of our team from across different disciplines - design, product management, user research, and engineering. It was fantastic to spend time face to face with other members of the team that we usually only work with remotely and to all go through the education together learning from each others approaches and ideas. The API Connect team attendees were split into three smaller teams to work on separate items and each was joined by a facilitator to help us work through the exercises.

We spent time together learning about the different phases of the product development lifecycle and in each looking at the process some of the best practices and ways to apply them to our product. It was particularly effective to use real examples from our roadmap in the exercises so we could collaboratively apply the new approaches and see how they apply directly to our product plan.

Each day of the course looked at a different phase of the product development lifecycle - Discovery, Delivery and Launch & Scale:

Discovery - Are we building the right product? - looking at and assessing opportunities and possible solutions we could offer for them, using evidence to build confidence and reviewing the impact this would have on our North Star Metric.

Delivery - Are we building it right? - ensuring we have a clear understanding of the outcomes we're looking for, how we can achieve them and how we can measure success.

Launch & Scale - Are customers getting value? - ensuring we enable customers to be successful in their use of the product and that we are able to get feedback and data to measure this and improve.

Each of these phases has an iterative approach to it and we looked at how we could apply these to our product plan. We also looked at some of the tools and techniques that can be used to help us apply this and members from the different product teams attending shared how they are using these today.

On the final day of the course I also had the opportunity to share some of our journey with instrumentation, how this has evolved and some of the lessons we learnt along the way - such as the benefits of having a data scientist on the team. I am looking forward to sharing this with the wider team and seeing how we apply some of the learning to improve our systems going forward. For example, better validation of decisions through measuring and improving our use of data.

API Connect Quick Check

This script originated as part of a much wider framework of tests that we put together when I was in the API Connect SRE team. However I’ve found this set of functions to be something useful to be able to validate quickly from time to time in different contexts to give a high level answer to ‘Is it working?’

The steps this script takes are as follows:

  • Authenticate to the API Manager Platform API and retrieve an access token
  • Take a templated API and Product and modify it to return a unique value
  • Publish this API to a nominated catalog
  • Invoke the API through the gateway (looping until a successful response is seen)
  • Query the Analytics APIs to find the event logged for this invocation (again looping until found)

Whilst the entire test frameworks a lot of assumptions around how our environments are built and deployed, this test was relatively standalone - and I just needed to make a couple of updates to it to work outside of our cloud deployments - add support to turn off certificate validation and for username/password instead of API Key based authentication. Take a look at the script on GitHub.

If you want to try this in your own environment you can follow these steps:

  1. Clone the repository

    git clone https://github.com/ibm-apiconnect/quick-check.git
    
  2. Install the python required dependencies

    pip install -r requirements.txt
    
  3. Identify the appropriate credentials to use for your stack - either username/password or an api-key if you are using an OIDC registry and set these as environment variables (APIC_API_KEY or APIC_REALM, APIC_USERNAME & APIC_PASSWORD) or use the command line parameters - either of:

    • -u <apim_user> -p <apim_password> -r provider/default-idp-2 (Local user registry or LDAP)
    • -a <apim_api_key> (OIDC e.g. SaaS)
  4. Download the credentials.json file from the toolkit download page to identify the client id and client secret for your environment - these can either be set as environment variables (CLIENT_ID / CLIENT_SECRET) or as command line parameters (--client_id / --client_secret)

  5. Run the script according to the usage examples

    python api-deploy-check.py -s <platform-api-hostname> -o <provider_org_name> -c <catalog_name> [credential parameters]
    

If successful, you should see output like this:

Example output from the script

I'd be interested to hear if you find this useful or if you have other similar utilities you use already - let me know!

Originally posted on the IBM API Connect Community Blog

Gilbert White walk, Selborne

This walk came from the In Their Footsteps app from the South Downs National Park. The app is made in conjunction with historic venues and has a series of guides for walks across the South Downs. Each of the walks has a map, a text guide and audio clips along the walk to tell you more about what you are seeing and walking through.

We headed for Selborne for an early start before the day got too hot and arrived at the car park in the village for 7:15am. The first part of the walk was a fairly steep route up through Selborne Common from the car park taking the zig-zag path that Gilbert White and his brother had cut into the hillside. At the top the route took us along the top edge of Selborne Hangar, a woodland of mostly beech trees. When there were gaps in the trees we could see through to Selborne and Gilbert White's House. Nova seemed to have a great time exploring and played in the leaves.

It then took us down Gracious Street to the sunken lane - Old Alton Road which is a fascinating path cut into the landscape by many centuries of walking and the sides of the path seem to be held back by the roots of the trees, it was interesting to hear on the audio guide how in the past this flooded and in the winter, icicles formed from the trees.

After this the route took us across meadows, past ponds to Coombe woods, another peaceful shaded woodland where we could enjoy listening to the sounds of the birds along our way. Finally we headed back up to the church and into Selborne to finish the route at Gilbert White's house.

Overall this was a lovely walk with a good variety of things to see - I thoroughly enjoyed it and was glad we made the decision to head out first thing before it got too hot as some of the parts would likely have been tough going later in the day! It was also a great walk for dogs with sections where Nova could have a good explore off-lead as well as those where there are lifestock where she had to be on lead.

Status Light

Whilst working from home it's useful for the family to know when I am on a video call or just a voice call. I was first looking at Busy bar which I came across via Hiro Report, but couldn't justify the cost of it and as I had a raspberry pi zero and a Blink! sitting around, I decided to build something simple myself. Maybe one day I could make it more complex and build a version using the Pico 2 W Unicorn Galactic?

Robot with Pi Zero

Hardware

Software Part 1 - LED Control Server

This is the application that runs on the Raspberry Pi and controls the lights based on a simple API call. I deploy this to my Raspberry Pi through Balena for ease of management and updates - then I can just push a new copy of the code into git and balena will automatically deploy it to my Raspberry Pi.

The API Call is very simple and currently accepts a GET request with parameters for the red, green and blue values (between 0 and 255) - really this should probably be a PUT request but using GET made testing with a browser simpler. The light is switched off with a DELETE call (or another GET with 0 for each parameter).

You can see the code for this in the light directory.

Software Part 2 - Webcam detection tool

This part runs on my laptop and detects when the webcam is in use through monitoring the system log - if a change in state is detected, it then sends an API call to the Raspberry Pi to switch the light on or off as appropriate.

The tricky part here was the detection of the webcam - I found a few different samples and a useful reddit thread (which I can't find now - will add the link later!) on ways to detect the webcam being operational on MacOS and it seems it is liable to change between MacOS versions - looking for eventMessages containing AVCaptureSessionDidStartRunningNotification, AVCaptureSessionDidStopRunningNotification or stopRunning seems to work for the things I've tested on Sequoia.

The alternative route I was considering was to use OverSight to trigger a CLI app and leave the detection to them - but having the CLI detect it was more interesting to build.

You can see the code for this part in the cli directory.

The code for this project lives at github.com/rickymoorhouse/status-light.

Isle of Wight

We decided to take a short family break on the Isle of Wight dung the school Easter holidays. We found accommodation in Yarmouth through Airbnb at a lovely spot overlooking the River Yar.

On Thursday morning we took the WightLink ferry over to the island in the morning and as we got there early they put us on the earlier ferry so we arrived to the Isle of Wight just after ten o'clock. We decided to head to Alum Bay and spend the day there. We first went to the viewpoint to see the Needles and then took the stairs down to the bay as dogs weren't allowed on the chair lift we knew we had to do this both ways!

We found a nice spot on the beach to sit and have our picnic and relax. Nova had a good time exploring around us and found her comfiest spot to sit was on Jess.

After a relaxing time on the beach we headed back up to the cliff top - Nova managed the just set of stairs but wanted to be carried up the bigger set. At the top we browsed the shops and had ice creams whilst listening to the live music. We then took the bus across to the Needles battery where we explored the headland and enjoyed the views all around before heading in to see the battery itself. From there you cold see exactly it why was a strategic point to be armed as it overlooked the entrance to the Solent - noone was getting in without passing into its range. We got drinks from the cafe before heading for the bus stop to return to Alum Bay.

We then checked into our cottage, had fish and chips and enjoyed the sunset - of course Nova managed to be the first one to try out the outdoor shower as she found something smelly to roll in.

The next day we explored from where we were staying down the route of the old railway line along the side of the river - we got to the End of the Line Cafe and then headed back and had a relaxing afternnon at the boat house - making use of the sauna and garden to enjoy the fantastic weather. In the afternoon Laura and I headed out for another wander along the railway path along to the end and back along the coast, stopping at Off the Rails for a drink along the way. Then in the evening we headed up into Yarmouth and out on the pier before collecting pizzas to take back to the boathouse to enjoy in the garden.

Time with the team in Kochi

I was fortunate to finally get a chance to visit my team in Kochi and had a fantastic few days with them, it was so great to be able to spend some time face to face after working together remotely for several years. I travelled to Kochi via Chennai with British Airways. In Chennai this meant I arrived through the international terminal and then had to clear immigration and head over to the domestic terminal next door. Immigration all went smoothly but then at the domestic terminal they didn't recognise my boarding pass for the Indigo codeshare that British Airways had given me, so I had to get help at the check in desks. Once this was all resolved I had to pass through security again and all went smoothly, efficient boarding and a short flight later I arrived in Kochi around 9 in the morning and was met by Akhil and Midhun at the airport to take me to the office.

I didn't have very much time to explore Kochi, with arriving on Monday morning and heading back over to Chennai on the Thursday night to spend a day with the team there on Friday but we managed to get away earlier one afternoon and head to the coast - then on the way it poured with rain so we ended up at a nice spot, Old Lighthouse Lounge, overlooking the coast where we could get some food and drink.

I tried a lot of different foods (whilst sticking to the less spicy options) heading to different places with the team each day I was there - I think my favourite was the local fish wrapped with spices and baked in a banana leaf followed closely by parotta (a flakey layered flatbread) and some of the different paneer based dishes.

There was a real buzz in the office there and it was fantastic seeing the sense of community there and the collaboration that went on within the teams. I managed to have a lot of conversations with different groups across the team, a few one on ones and a couple of full team meetings, but there's lots more that could easily taken another week as the time flew by too quickly. I hope to see them all again soon!

TheCompoChallenge - Photography

For 5 weeks, Hiro ran a photography challenge series with the aim to focus on different techniques in photographic composition each week. I joined in from the start and found it really insightful to try and use the particular techniques during the week as I took photos. Some of these were much harder to find opportunities for than others and it was interesting to see other peoples photos shared on social media during the challenge as well.

Here are the photos I took with each technique during the challenge (and a couple I added in subsequently)

1. The Rule of Thirds

The Rule of Thirds challenge is all about getting your subject out of the middle of the frame.

2. Lines

Leading lines are lines within the frame of your shot that naturally draw the viewer’s eye to your subject.

Diagonal lines accomplish something similar but don’t always have to point directly at your subject

3. Frames

This technique asks you to find ways to create a frame around your subject in your composition. This might be a doorway, a trellis, trees hanging over a path, a window, shadows around a patch of light, and so on.

I struggled with this one - whilst I found possible frames - there wasn't a subject around to frame them with! After the week I managed to get this one with the blossom framing the building at the University of Birmingham:

4. Subject Isolation + Contrast

Contrast is a really cool element of photography that can be used a lot of different ways. It could be very visual by putting a brightly lit subject against a dark background, or color based by contrasting a bright red rose against green foliage, or even conceptual with something like capturing someone who is clearly quite happy on a bus surrounded by dour fellow passengers.

5. The Golden Spiral

The Golden Spiral technique is all about leveraging the elements in your photo to draw your viewer's eyes around the frame en route to settling on your principal subject.

Again I didn't manage to get any photos for this one but am hoping to try in the future.

Remote Gateway on Openshift

This post should guide you through the steps on how to deploy a datapower gateway to use as a remote gateway with API Connect Reserved instance, optionally configuring the inbound management traffic through IBM Cloud Satellite Connector.

Overview diagram

Installing the Operators

To install the operators in your cluster, the steps are as described in the documentation on how to install the operators

Set up certificates

Again follow the steps for creating certificates in the documentation.

Deploy the Gateway Cluster

Deploying the gateway cluster into Openshift is just a case of creating the GatewayCluster CR - you can start from this template. NB. You will need to ensure that spec.license.use is set to production if you are using the RI provided image registry as we don't provide the nonproduction images.

  • Create a pull-secret with access to download the datapower images and reference it under imagePullSecrets. You can download the image to mirror to your registry from the 'Download Gateway' button in the reserved instance Config Manager.

  • Create a secret containing the password for the datapower admin user and ensure it is referenced under adminUser - you can use the following command to create this:

    oc create secret generic admin-secret --from-literal=password={SET-PASSWORD-HERE!}

  • Update imageRegistry to point to your image registry.

  • Update the jwksUrl for your reserved instance, this needs to be the platform api endpoint for the reserved instance followed by /api/cloud/oauth2/certs - you can find the platform api endpoint url from the 'Download Clients' link in the API Manager interface.

  • Select and configure the appropriate profile for your cluster.

  • Create a secret with the CA the reserved instance endpoints are signed by - Let's Encrypt X2 Root CA (Download from the Let's Encrypt site) and ensure the secretName for mgmtPlatformEndpointCASecret points to this.

    curl https://letsencrypt.org/certs/isrg-root-x2.pem -o isrg-root-x2.pem oc create secret generic isrg-root-x2 --from-file=ca.crt=isrg-root-x2.pem

  • [Optional] If you are routing the inbound traffic through IBM Cloud Satellite Connector, you will need to configure the hostname for the gatewayManagerEndpoint to match the private cloud endpoint hostname for your connector - typically c-01.private.{region}.link.satellite.cloud.ibm.com.

  • Apply the gateway cluster yaml

  • You can check the status of the cluster using oc get gatewaycluster. If you see any issues you can use oc describe gatewaycluster for more details.

Set up Satellite Connector [optional]

Optionally, deploy a satellite connector agent on the same cluster as the remote gateway

  • Create a Satellite Connector
  • Deploy the agent
  • Create a Connector Endpoint for the gateway management interface docs. For the Gateway management endpoint you will need the following details:
    • Destination FQDN: {gateway-cluster-name}-datapower.{namespace}.svc e.g. api-gateway-datapower.apicri-gateway.svc
    • Destination Port: 3000
    • TCP

Register gateway with Reserved Instance

Create TLS Client Profile so that the manager can trust the CA that signs the certificate for the gateway management endpoint. This can be done through the RI Config manager under TLS.

  • Create a Trust Store containing the CA Certificate which can be obtained by copying out the ca.crt from the gateway-manager-endpoint-secret and putting it in a file named ca.pem (API Connect needs the .pem extension for the upload to be accepted.)
  • Create TLS Client Profile referencing the Trust store created

Create TLS Server profiles to present to clients invoking the APIs:

  • Create TLS Key Store containing the certificate and private key to present - typically these would be obtained through an external Certificate Authority.
  • Create a Server profile referencing the key store created.

To register the gateway on the 'Gateways' tab you will need the following details:

  • URL of management endpoint: If using Satellite, this is the link endpoint URL including the port number. If not, this will be the hostname from the gatewayManagerEndpoint in the gateway cluster CR.
  • TLS Client Profile: profile created above
  • Base URL of API Invocation endpoint: The host from the gatewayEndpoint in the CR that inbound clients will use
    • TLS Server Profile: profile created above