Lambda Integration in IBM API Connect on AWS
This blog post will provide you an overview of our Lambda integration in API Connect on AWS, what you could use it for and a simple worked example of setting this up. If you’d prefer you can watch me demonstrate this in our video on YouTube.
Lambda is serverless computing platform provided by Amazon Web Services (AWS) which lets you build and deploy your code in a number of different programming languages with easy integrations to AWS services without having to manage infrastructure or servers. This makes it an ideal place to build out your API implementation and when you combine this with our API Connect on AWS SaaS offering you can quickly build, manage and socialise your APIs without worrying about the infrastructure behind them.
Using our Lambda policy in the SaaS service makes this simple and straight forward to integrate these so you can build out your apis around numerous different AWS services then manage them centrally through API Connect, sharing them with consumers through our customisable developer portal.
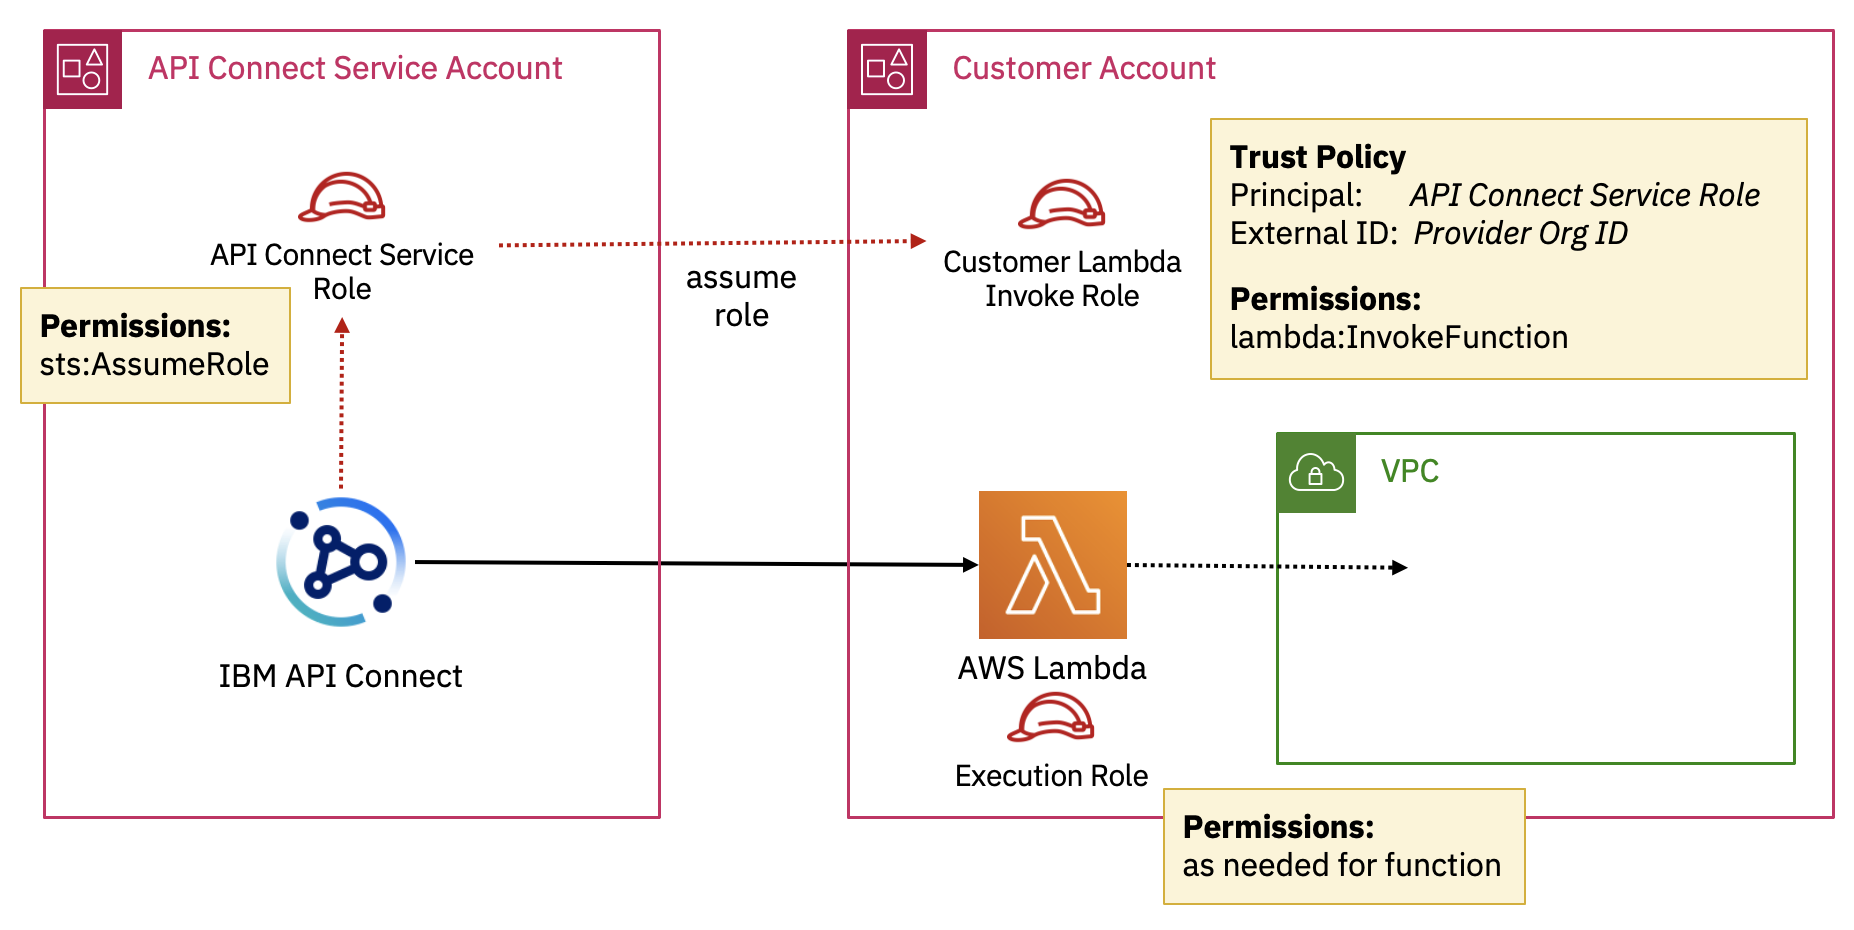
In order to manage the integration securely we use AWS Security Token Service (STS) so there is no need for you to give API Connect the credentials for your AWS account, you can just create an IAM role and grant permission for API Connect to assume that role.
The API Connect service is running in our AWS account and we have a fixed STS role that the service uses for each region:
| Region | Role |
|---|---|
| US East | arn:aws:iam::623947394061:role/ibm-apiconnect-us-east-a |
| Frankfurt | arn:aws:iam::623947394061:role/ibm-apiconnect-eu-central-a |
| London | arn:aws:iam::623947394061:role/ibm-apiconnect-eu-west-a |
In your AWS account you would set up a role that has permission to invoke your Lambda function(s) and set up the principal for the trust policy to be our service role and the external ID to be your provider org ID of your API Connect service instance. You can set this role to grant permission for just a single lambda function or multiple depending on what you need.
Within API Connect you will find the Lambda policy in the API Assembly editor on the Gateway tab along with all the other policies you can use to build out your API. The preferred model is to configure the lambda policy using the STS Assume Role option, however we do also support providing an Access Key ID and Secret Access Key. Then along with the credentials you just need to specify the name of the function and the region you have the lambda function deployed in.
To do this for yourself you can follow along with my simple worked example:
1. Create Lambda function
From the AWS Console, select Lambda then Create function - either start from scratch or make use of the ‘Hello World’ blueprint example. If you start from scratch and want to use the simple echo function I demonstrate in the video, give your function a name and select NodeJS as the Runtime - you can leave all the other settings the same unless your organisation has specific requirements around roles and permissions. Then click Create function.
Here is the code for the simple example from the video, which you can copy and paste into your function - alternatively you can use an existing function or write something more useful yourself:
export const handler = async(event) => {
    // TODO implement something more interesting here!
    const response = event;
    return response;
};
After the code is updated in the function, click Deploy.
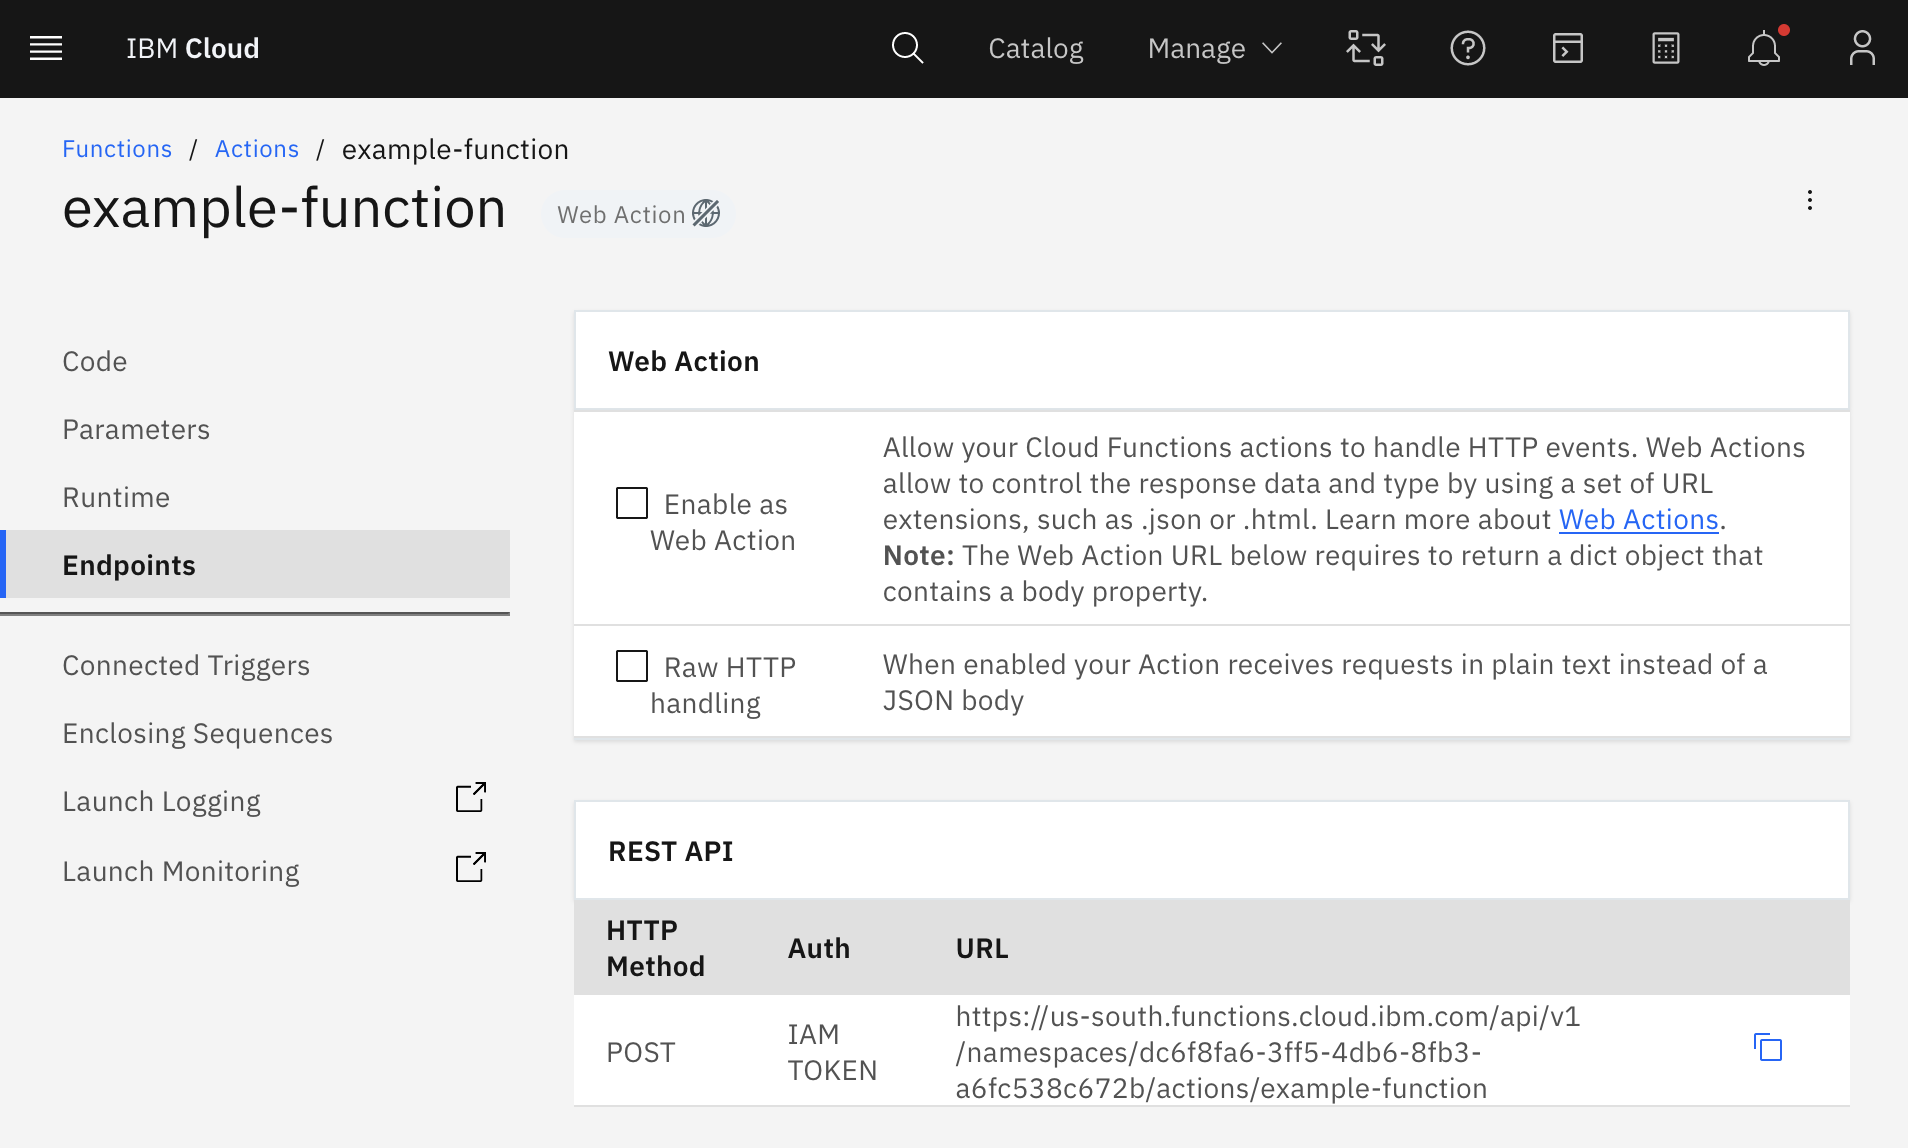
Take a note of the function name and region your function is deployed in - both are part of the displayed function ARN - arn:aws:lambda:{{region}}:{{account}}:function:{{functionName}}
2. Create a role
Now you have the function created you will need to create a role to grant API Connect permission to assume which can invoke the function - for this, go to IAM and select Roles within the AWS Console.
- Select Create role
- Select Custom trust policy
- Update the trust policy to have set the Principal to the API Connect role for the region you are using (see the table above) and set the “Condition” to require an external ID of the provider org you are using in the API Connect service- you should have something like the following:
{
    "Version": "2012-10-17",
    "Statement": [
        {
            "Sid": "Statement1",
            "Effect": "Allow",
            "Principal": {
                "AWS": "arn:aws:iam::623947394061:role/ibm-apiconnect-eu-central-a"
            },
            "Action": "sts:AssumeRole",
            "Condition": {
                "StringEquals": {
                    "sts:ExternalId": "ac51909e-a379-4153-a0e8-ef4a25a83405"
                }
            }
        }
    ]
}
Next, create a permission policy for the role to allow it to invoke lambda functions - something like this (you can also specify the function within the Resource field to limit which lambda functions API Connect can invoke):
{
    "Version": "2012-10-17",
    "Statement": [
        {
            "Sid": "VisualEditor0",
            "Effect": "Allow",
            "Action": "lambda:InvokeFunction",
            "Resource": "*"
        }
    ]
}
Now you have the Lambda function and Role configured we’re ready to start making use of this function within API Connect
3. Create your API in API Connect
To do this, open API Manager - if you don't already have a trial instance to use, you can create a free trial now.
- Select Develop APIs and Products.
- Create a new API using the Add button and selecting API (from REST, GraphQL or SOAP).
- Select New OpenAPI.
- Complete the details for the name and path and click Next.
- Confirm the security options and click Next.
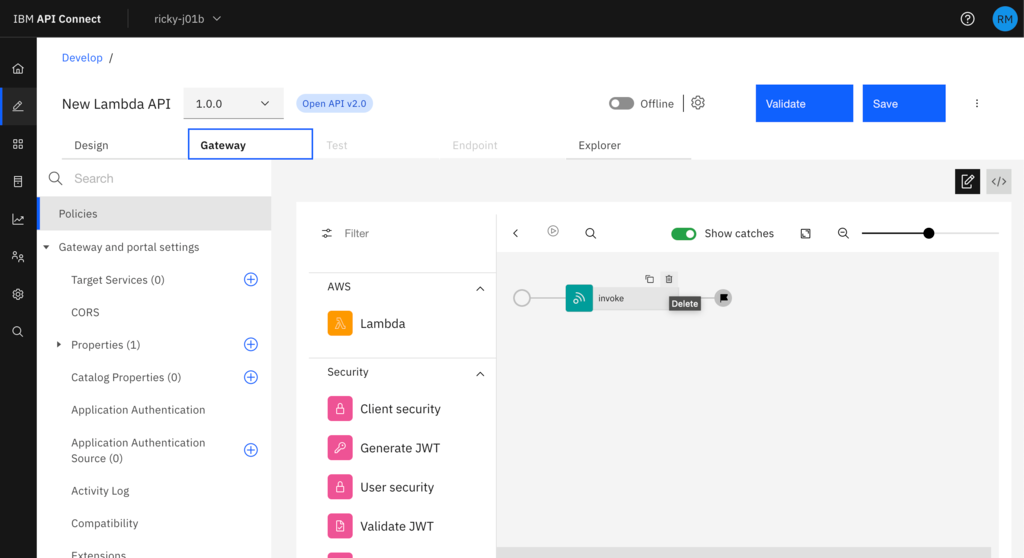
Now you have completed the guide to create the basic API you can set up the OpenAPI specification for it as you would like before moving on to configure the implementation. To configure the implementation, select the Gateway tab, remove the default Invoke policy by hovering over it until you see the bin icon - and then click it.
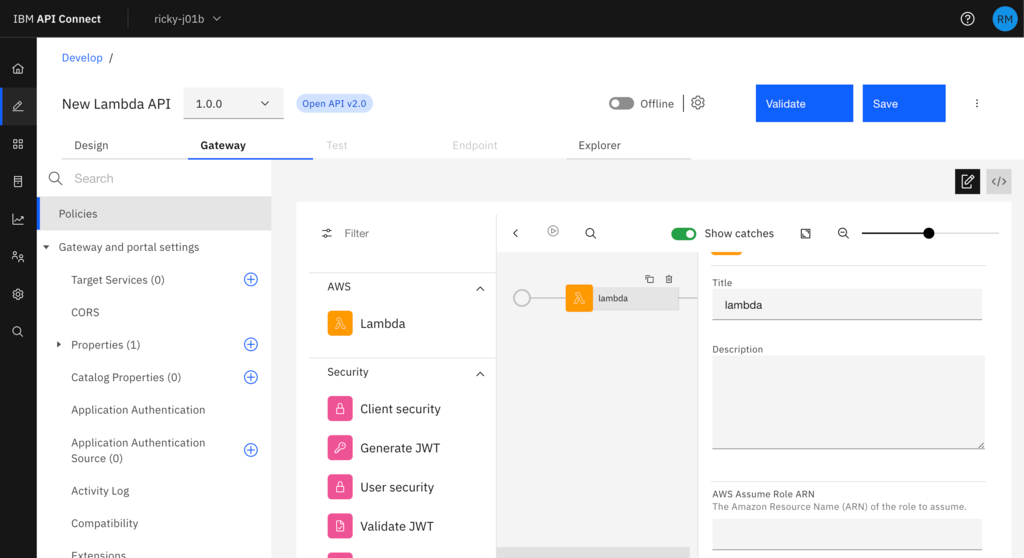
You can now drag the Lambda policy across in its place and fill in the details from your Lambda policy as the parameters (role, function name and region).
Now you have the Lambda policy in place you can Save the API, and toggle the Online indicator to make the API available to test and then try it out under the Test tab.
There we have an API implemented end to end from a serverless function in AWS Lambda through to defining the OpenAPI spec for it and managing it in API Connect. You could now go on to share this API with Consumers through the Developer Portal, or continue to build out the functionality with additional policies first.
Try it for yourself by signing up for our free 30 day trial today.