2026
Adding SocialSpec to my site
On Tuesday, Caleb Hailey announced SocialSpec around the premise that the future of social media is websites. This maps out a consistent way to expose key social data (about, contact, following) from your website based around existing standards and ways things are typically done already. This makes it very easy to adopt and add to an existing website - for me this meant the following:
Start with a feed
I'd previously ended up with my feeds available at multiple URLs so this was an opportunity to clean things up. Rather than just copying what I had to the feed.xml and feed.json locations and add more complexity, I decided to make these the definitive sources for my feed and redirected the old URLs to them through edge rules. To get Hugo to create an RSS feed in another location to the default index.xml (which I'd never liked), I created a custom output format for RSS and referenced this in the config. I already had a custom output format for jsonfeed as Hugo doesn't have that built in. My custom output references my adapted rss.xml, but you could just point to the built-in one. The config.yaml looks like this:
outputFormats:
  feedxml:
    mediaType: "application/rss+xml"
    baseName: "feed"
    rel: "alternate"
    noUgly: true
  feedjson:
    mediaType: "application/feed+json"
    baseName: "feed"
    rel: "alternate"
    isPlainText: true
outputs:
  home: ["HTML", "FEEDXML", "FEEDJSON"]
About Page - aboutspec.org
I updated my blog build process to copy my markdown about page into the .well-known folder:
cp public/about/index.md public/.well-known/about.md
Contact Me - contactspec.org
I exported a vCard (.vcf) and updated it to just have the values I wanted to share. I then dropped this in my static/.well-known/ folder and updated my CDN settings in Bunny to serve it as text/vcard based on the file extension. This works as an Edge Rule where if the RequestURL matches *.vcf, then it sets a response header.
Following - followspec.org
Initially I was just going to export an OPML file from NetNewsWire, but I decided to create a data file for the blog so Hugo would generate both an OPML file to put in .well-known as well as an HTML blogroll which will hopefully make both easier to update going forward. Again this needed a CDN update for the content type to text/x-opml.
Testing this
After adding these I explored testing them through HyperTexting, Caleb's social news feed based on the existing connections across the open web - an ungated social network. As this didn't work I built my own test tool with Claude to validate what I had set up against the spec. After contacting Caleb, it turned out the version available at the time wasn't yet using the full spec but rather an earlier iteration - but on the TestFlight version of the update it worked perfectly. For now I have added a temporary edge rule to redirect the hypertexting specific URLs.
This is early days for the spec but looks to be a good way to make social connections more open.
From Architect to Product Manager
This week I moved from being the Architect responsible for our API SaaS offerings to being a Technical Product Manager for IBM API Connect.
This is something I've been exploring for a while. Over the last few years I've been exposed to more of the product side, as SaaS has had a natural affinity to data-driven thinking, product-led growth and pricing. Meeting technical product managers who came to IBM with the webMethods acquisition and attending the team education last year was probably the turning point that made this something I wanted to do.
Technology roles are changing rapidly as AI spreads across organisations and it feels more important than ever to be at the intersection between customers and the product - to apply my experience and judgement to shape what we build.
I've worked with numerous customers and partners using API Connect through my time in SRE and Architecture, seeing how they use the product and the places it fits in their real workflows (and the places things aren't going so smoothly). I am keen to take these insights alongside my experiences running the cloud offerings to help define where the product goes next. I will lean on my engineering experience in making this possible, advocating the value of the invisible work, stability and reliability, as the foundation our new features are built on.
In the team I will be product owner for API Studio, our API development experience, but I'll be working across the portfolio.
What does your day-to-day API development experience look like, and what is the single biggest thing you wish were different? Let me know.
API failure stories and what they taught me
API failures often come from missing lifecycle controls rather than difficult technology. These generalised stories from my experience show how unchecked assumptions around versioning, testing, logging, and access control can create avoidable problems.
When API versions stop making sense
Imagine an API with versions like these:
v1, v1-updated, v2, v2-legacy, v3-final, v3-final-final
The problem isn't that multiple versions exist. Supporting multiple versions in parallel is a common, deliberate and reasonable decision. The problem here is missing lifecycle controls to define how versions would be created and retired - each time the API was changed the versioning approach had to be reinvented alongside the change. This results in no one knowing:
- which versions are in use
- which consumers are using which ones
- which versions can be safely retired
- what would break if one of them was turned off.
This also made consumer-reported issues harder to diagnose: before debugging could begin, the team first had to establish which API version the consumer was using.
Up front you need to define a versioning and deprecation strategy - it needs to cover how breaking changes are identified, how long older ones remain supported and how consumers will migrate. Structured usage data is also essential as you need to know which consumers are still actively using a version before you can safely retire it.
A migration without reusable tests
A migration was planned - same software but a different environment and with it new network routing. The migration itself was straightforward, but the lack of reusable tests made it a lengthy manual comparison exercise. This consisted of calling each API in turn with curl on the new and old environments, then painstakingly comparing the responses and headers - each subtle difference discussed and examined - will this cause a problem anywhere?
The migration exposed differences in how network paths and forwarding headers were handled. Some consumers behaved differently in the new environment as the pre-cutover manual testing didn't cover every consumer behaviour.
Testing needs to be considered an ongoing exercise and even if you find yourself coming up to a change without tests, building them for re-use based on the existing traffic rather than as a one-off migration exercise will bring benefits. AI tooling can assist with comparisons generating initial tests and sample calls, but the resulting tests still need to be reviewed against the contract and the intended behaviour and maintained over time.
Sensitive data in the wrong places
Operational reviews can surface sensitive data in places it shouldn’t be. The discovery then triggers an incident response process, which then has to establish how the data had arrived, where else it had been stored, and how it could be removed. This then can lead to identifying other places where sensitive data wasn't being handled as intended in the implementation.
Solving this properly is something that needs to start in your API design - make sure you have a good understanding of all the sensitive data your APIs will be touching and how it will be handled. Then build up a layered approach to protect it:
- API design: sensitive data should never be logged in plaintext, so shouldn't appear in the query string - if needed for a query then do this through a POST body but make sure you have no logging of body content.
- Redaction: configure redaction policies for fields containing sensitive data to keep them out of logs
- Log levels: ensure the logging levels you have don't log request and response body
- Environmental configurations: sometimes you may need to see how data is handled in dev, but restrict when it goes to UAT or preprod - apply this at the environment level.
Any per API setting needs to be checked in your pipeline and used as a gate - then your development debugging never accidentally makes it to production. For a deeper look at implementing these controls in API Connect, see Securing Sensitive Payload Logging in API Connect.
Authenticated does not mean authorised
This first came to me in a quiet conversation - "I think we found a bug in the portal", but turned out to be a misconfiguration based on false assumptions. The portal used OIDC-based SSO through an identity provider that allowed self-registration. Authentication was working, but no authorisation controls had been configured - once you were in you could see, subscribe and call any API - they were effectively public to anyone who could self-register with the provider.
Fortunately in this instance, no one had exploited the misconfiguration before it was caught and corrected.
Whilst some APIs may have been intended for a wide public audience, the majority weren't. The solution here is granular controls ensuring you control who can discover the API exists (visibility) and who can subscribe to it (subscribability). For APIs that need more control, make use of explicit approval flows so access to the individual API becomes the control point. The key thing to remember here is that we need both authentication (who someone is) and authorisation (what they may do).
In each case, the technology was capable of doing the right thing. The problem was that an assumption had not been turned into a documented rule, an automated test, or an enforced control.
Next time, before releasing or changing an API, ask:
- Do we know how breaking changes will be versioned and deprecated?
- Do we know which consumers use each version?
- Can we repeat the tests that validate the API’s expected behaviour?
- Have we identified sensitive data and prevented it from reaching logs or query strings?
- Have we verified we have both authentication and authorisation configured appropriately?
- Are these expectations enforced in the delivery pipeline rather than just relying on people remembering?
Netherlands 2026
Netherlands 2026
- 31 Jul - Folkestone
- 1 Aug - Doorn
- 3 Aug - Utrechtse Heuvelrug National Park
- 4 Aug - Utrecht
- 5 Aug - 📷 Zaanse Schans
- 6-7 Aug - Amsterdam
- 8 Aug - 📷 Kinderdijk
- 9 Aug - Henschotermeer
- 10 Aug - Wijk bij Duurstede
- 11 Aug - Calais
Folkestone
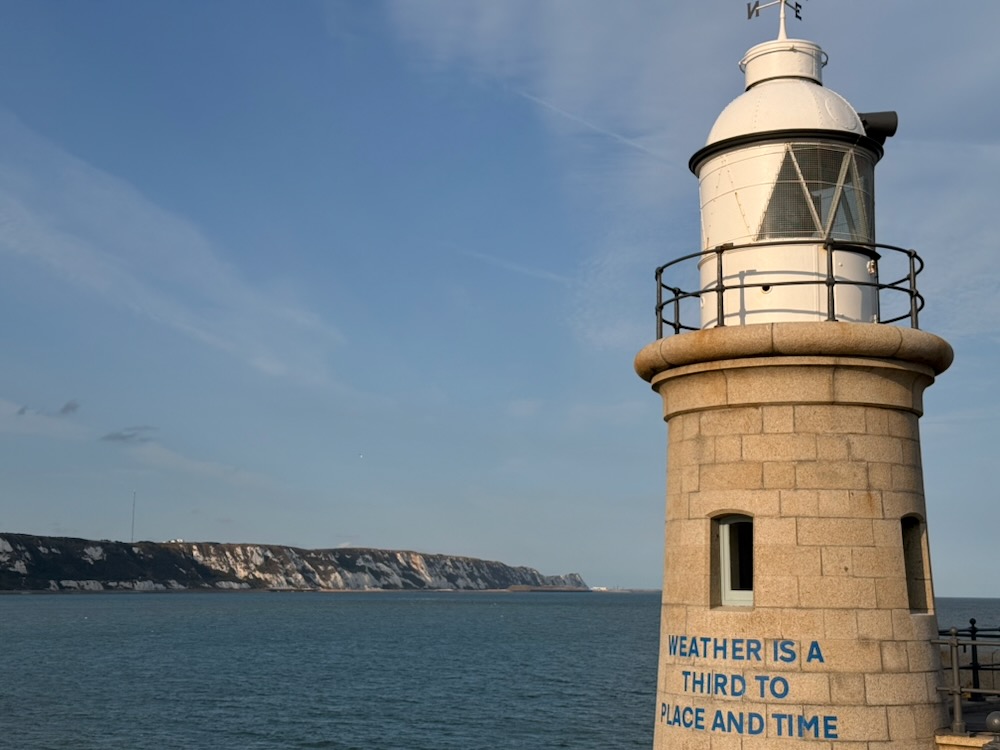
To start the holiday we headed across to Folkestone where we stayed a night at the Holiday Inn Express before our early morning booking for Le Shuttle the next morning. After checking into the hotel we noticed that Nova was licking her paw a lot, so decided we should get it checked out. We managed to find a nice helpful local vet who could see her that evening and it turned out she had a grass seed stuck in between her paw pads. He managed to remove it and gave her some medicine to stop it from bothering her as much. We then had Fish and Chips on the sea front and enjoyed exploring the conversion of the station area.

Doorn
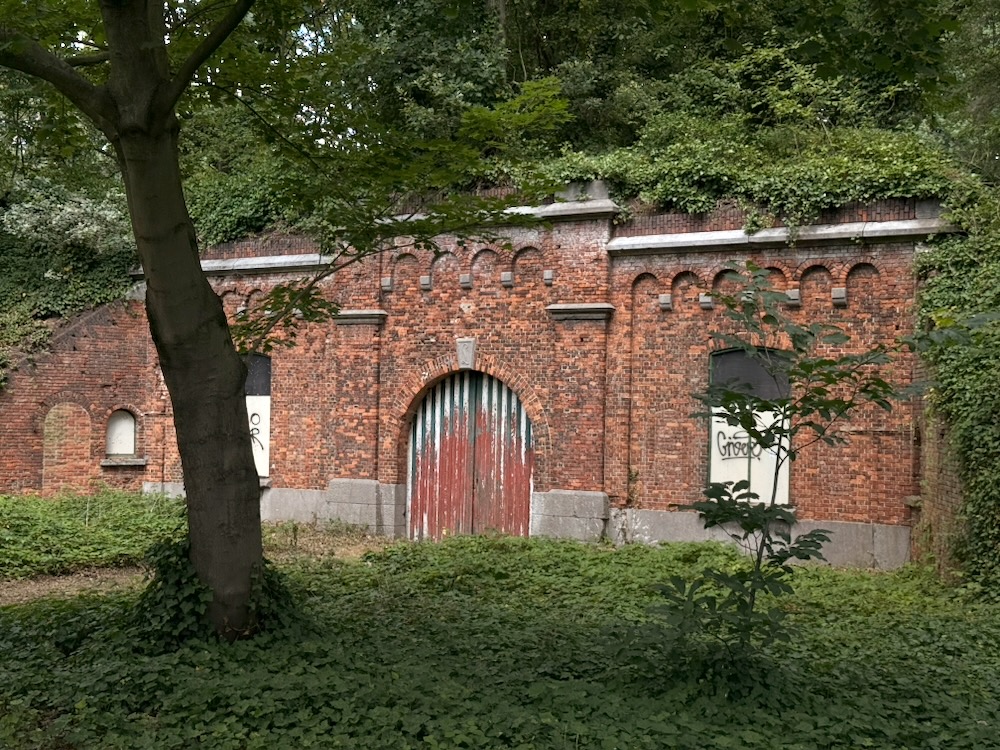
Border controls were busy in Folkestone so we ended up on the next train, but the crossing itself went very smoothly. We stopped to get a drink before heading on to the motorway. We stopped by Fort Merksem for a lunch stop and a walk around the Fort.
After this we headed on to Doorn and after a GPS input failure taking us to the same road in a different town we made it to the house we'd be staying at. In the evening Kai and I went to Jumbo to do some food shopping and Nova enjoyed exploring the garden.
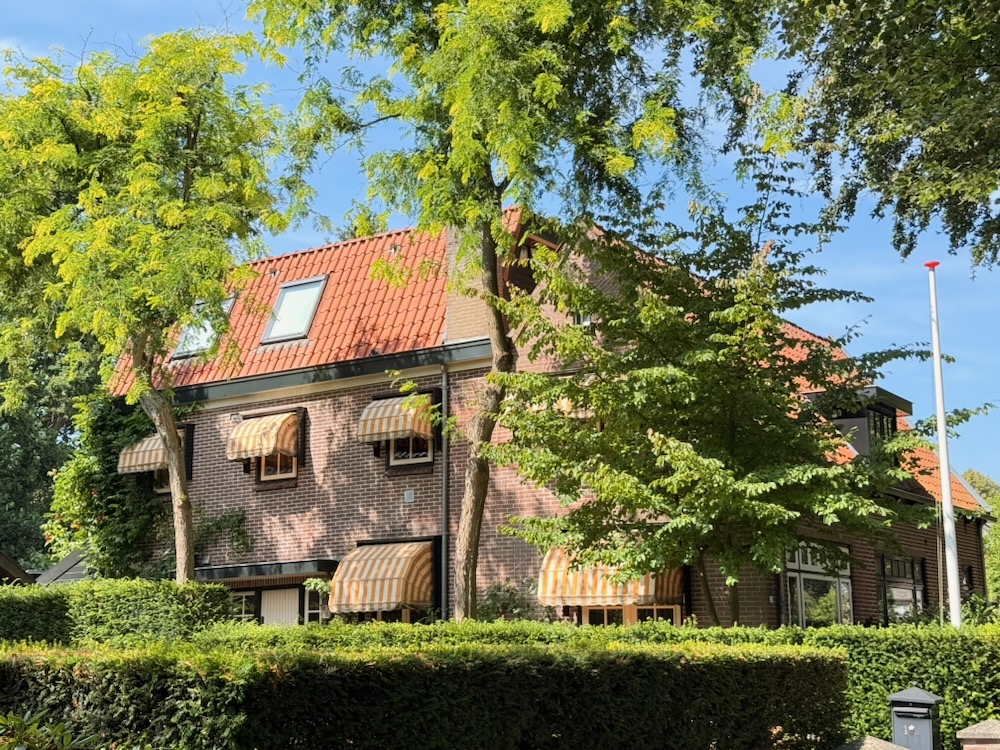

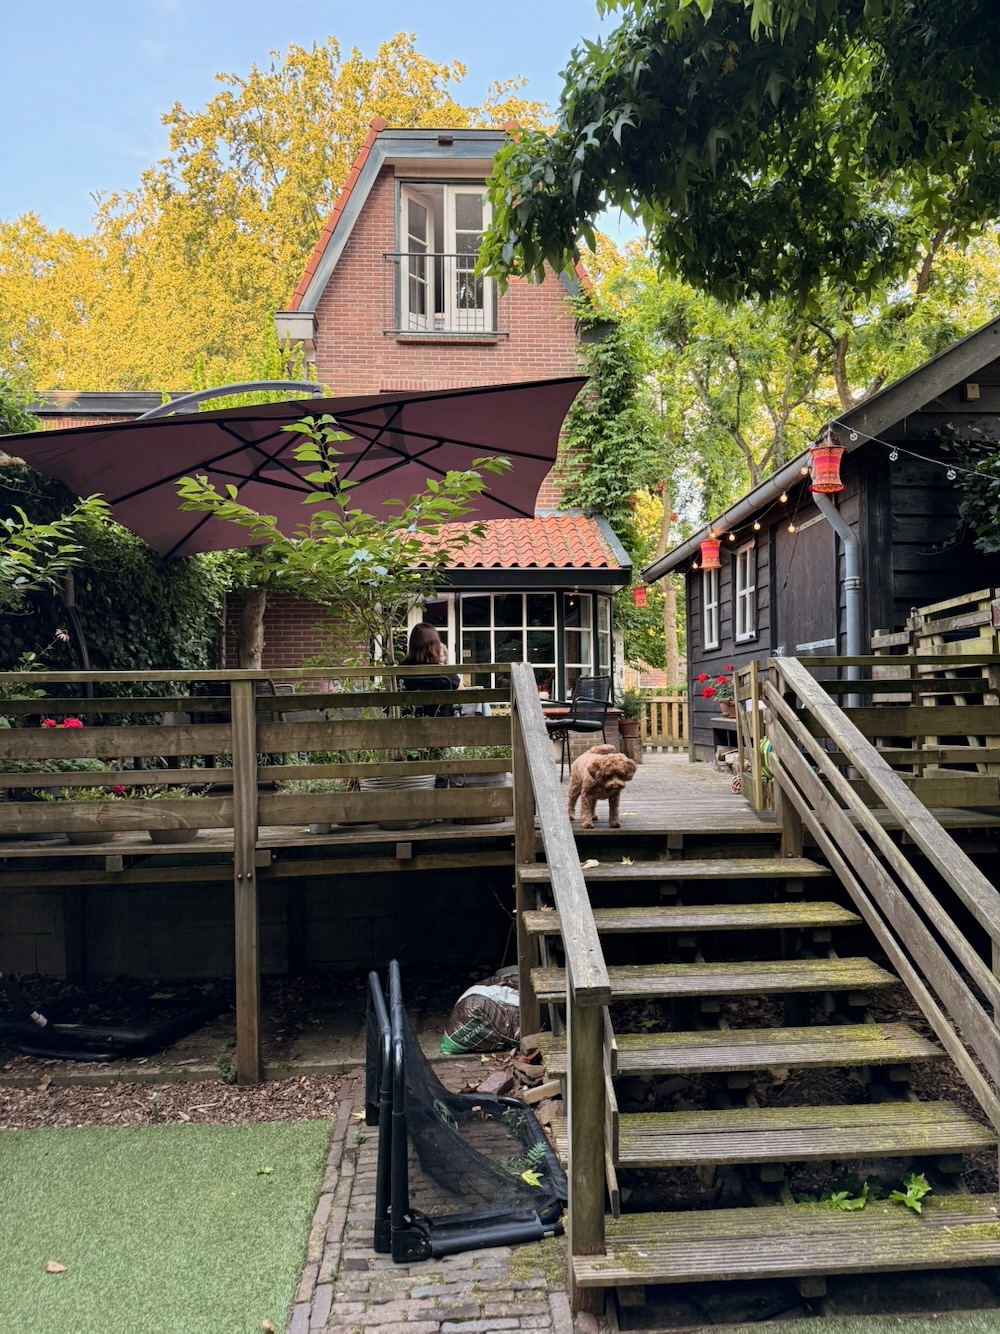
On Sunday we had a quiet day to recover from the journey and enjoy the surroundings of Doorn.
Utrechtse Heuvelrug National Park
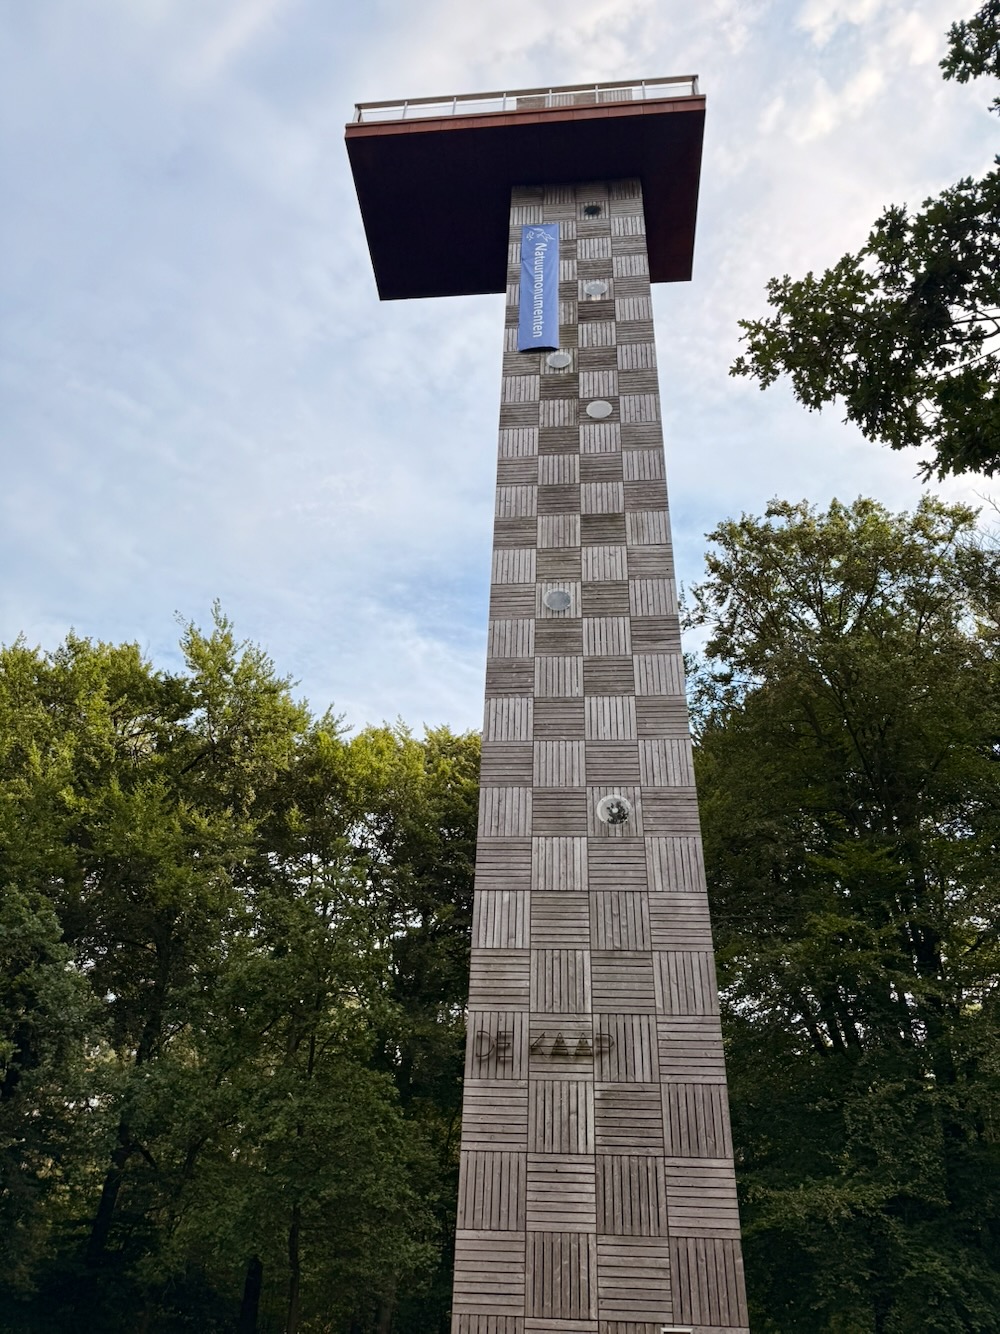
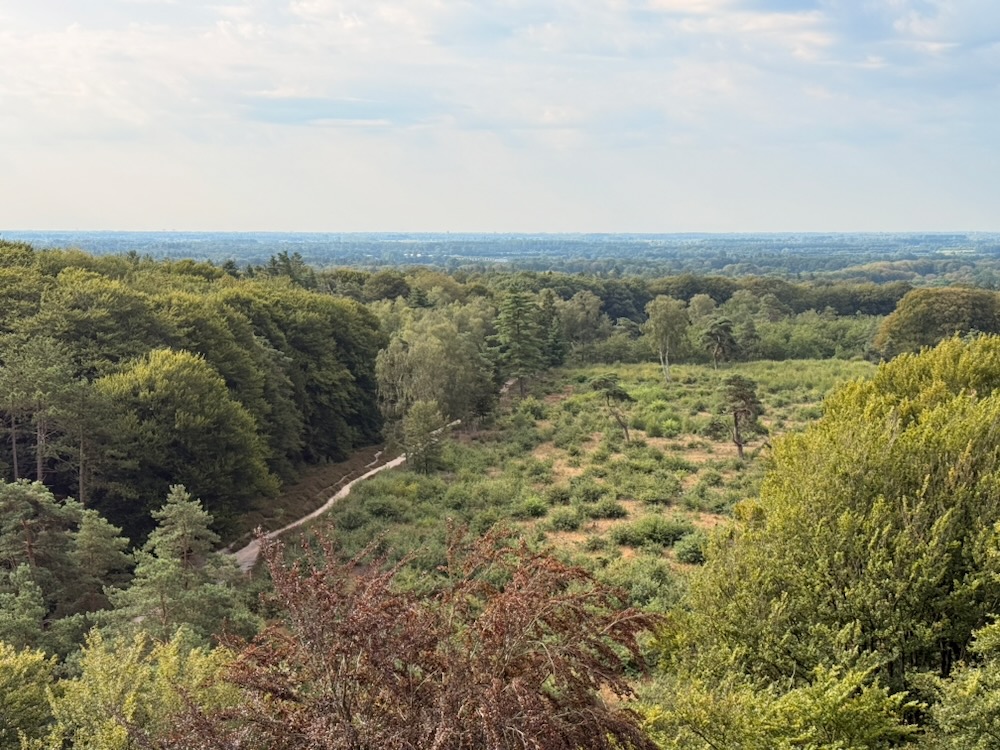
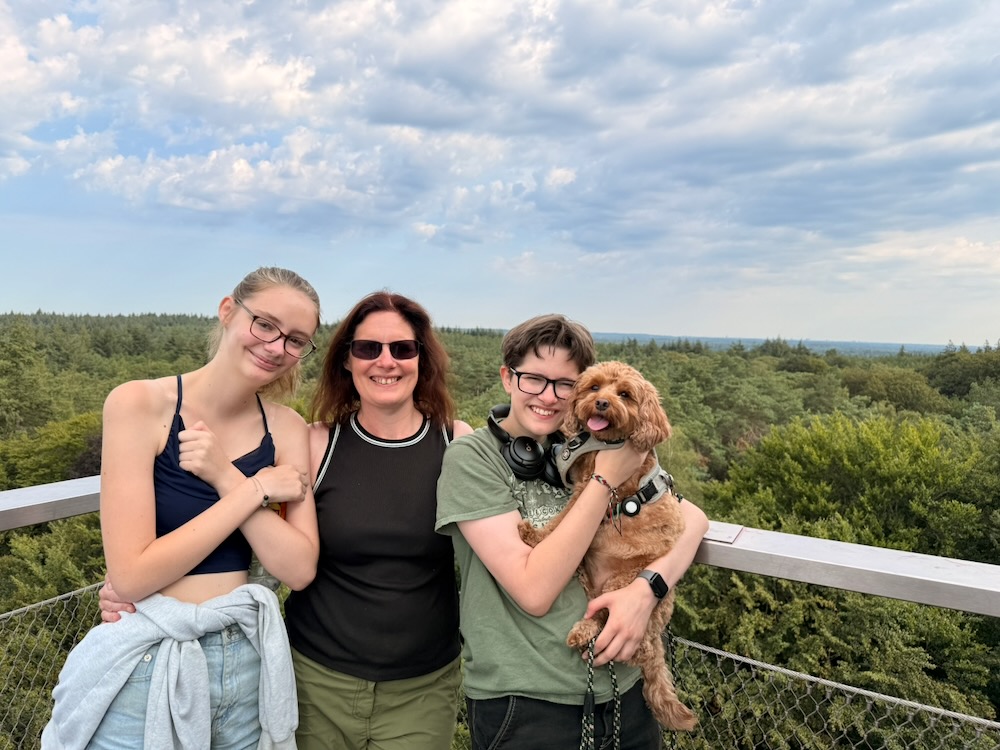
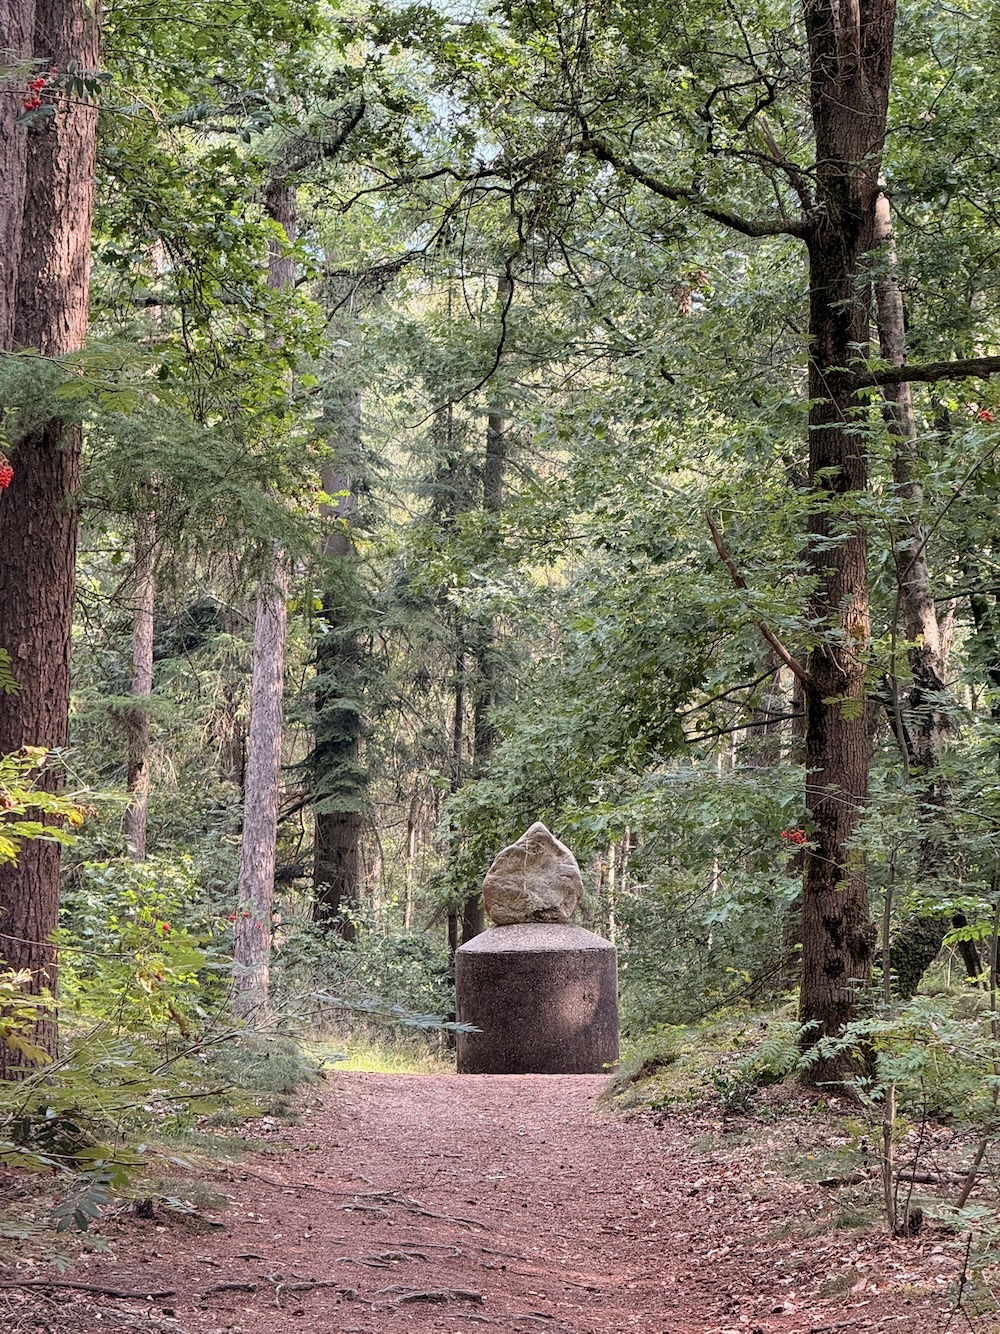
On Monday we headed out to explore the trails in the National Park on our doorstep. We parked by Chalet Helenaheuvel and headed out on the trails from there. The area we walked in was a lovely forest area with clear trails and we walked through the forest to the Uitkijktoren de Kap and went up to the top, thankfully it was still early so not too hot! At the top there were great views for a long way around 3 sides of the tower - we could see Utrecht and the Pyramide van Austerlitz

Utrecht
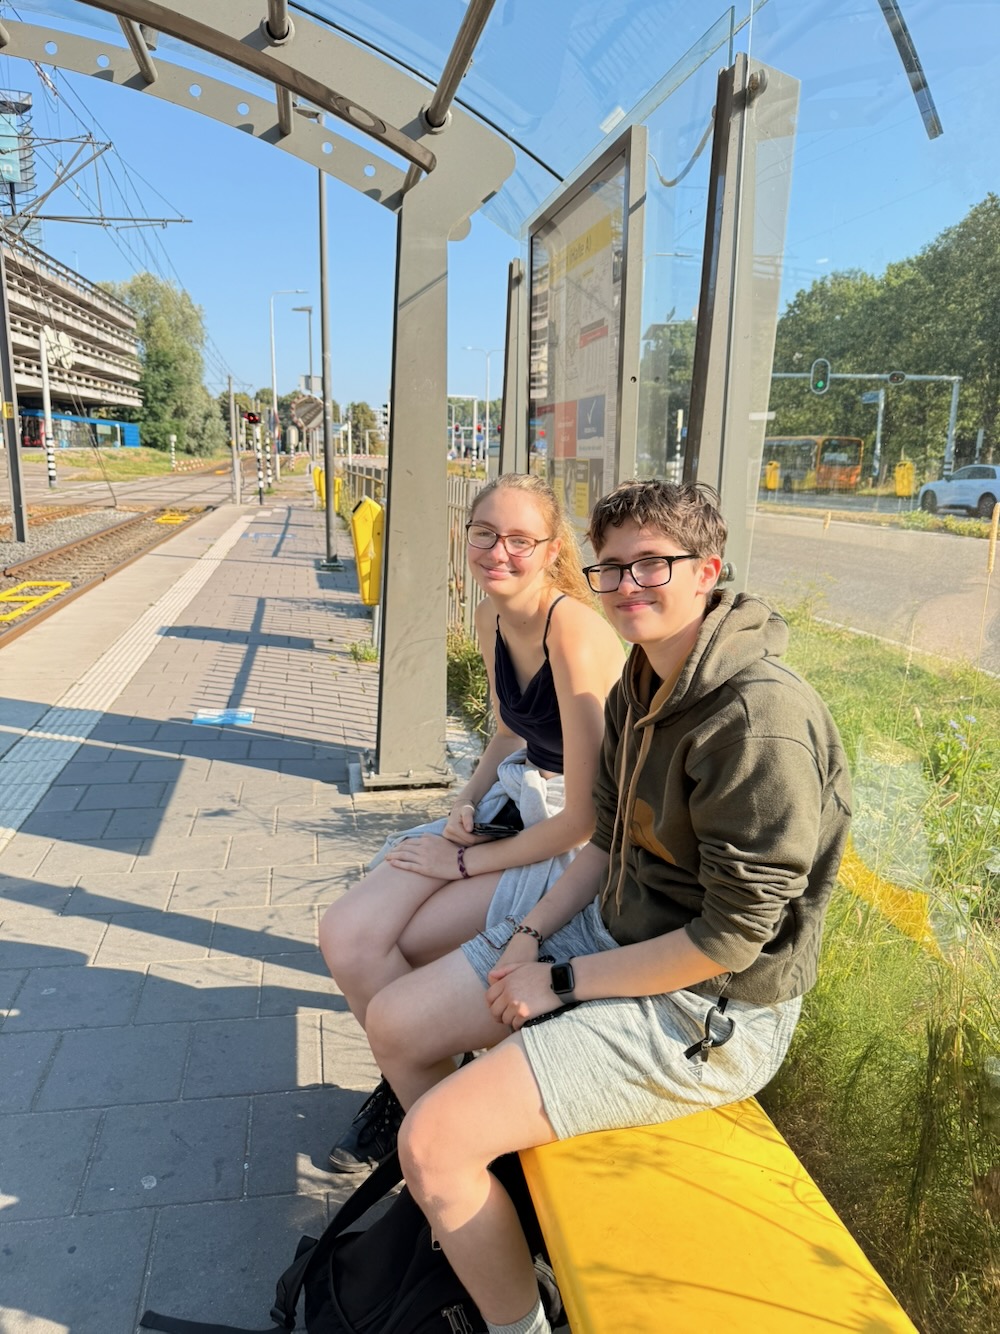
Utrecht was the plan for Tuesday and originally we were planning to take Nova in the morning, but in the end just Kai, Jess and me headed in. We took the Park and Ride from Westraven and got the tram to Utrecht Centraal
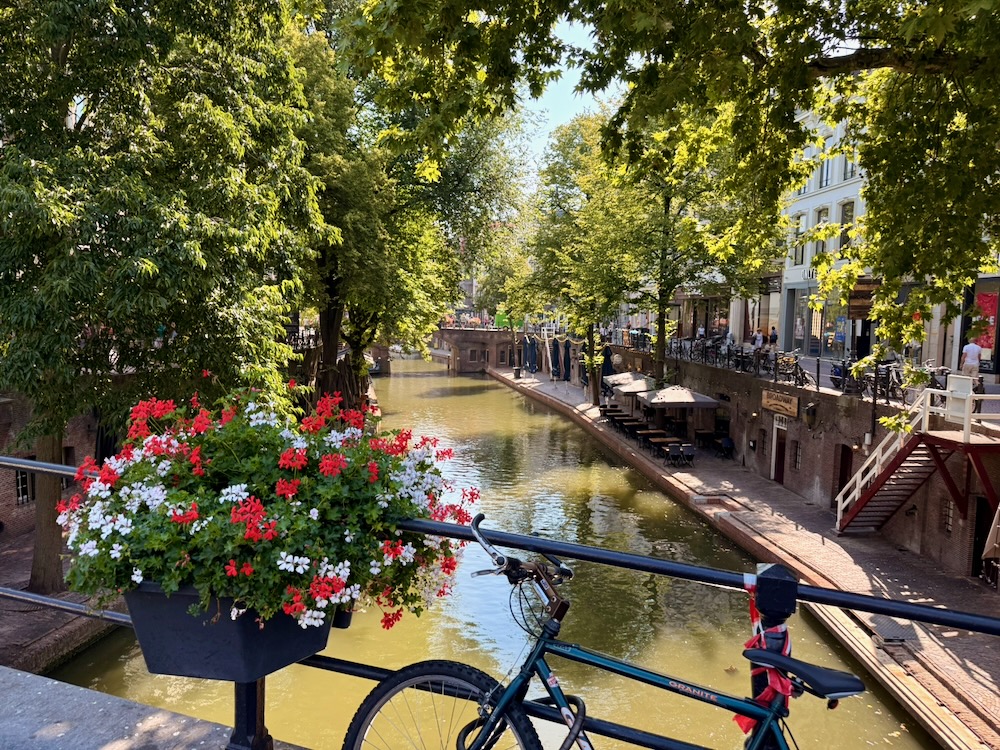
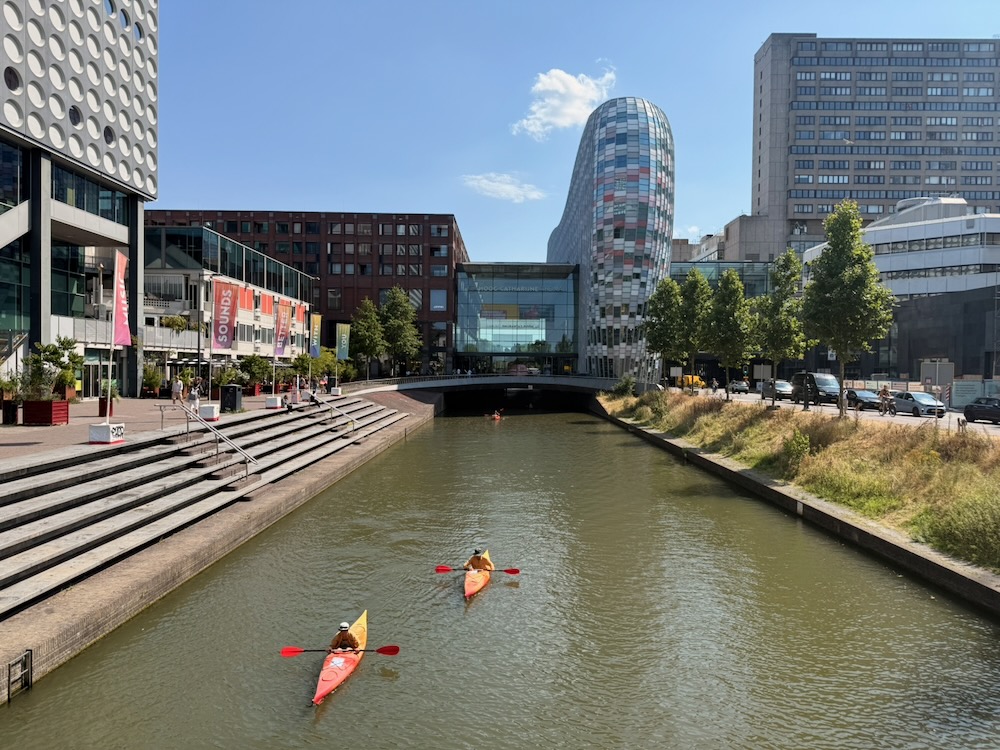
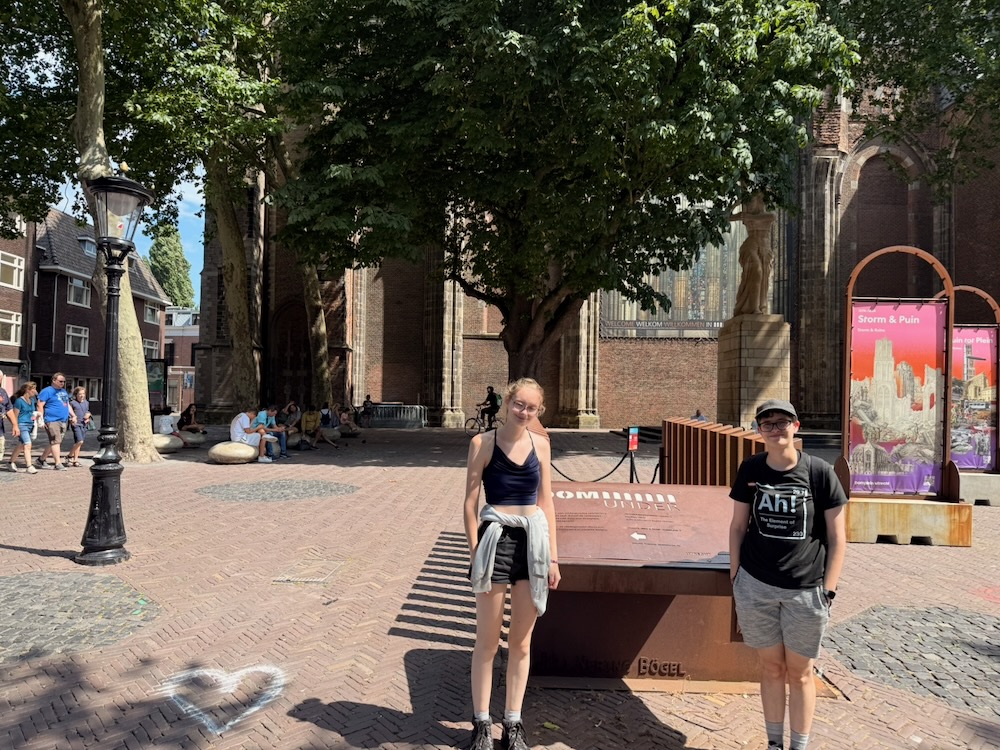
Utrecht is a beautiful city with pretty canals built around a central tower. Originally it was part of the Northern border of the Roman empire and as such a fortress on the edge of the Rhine. We took the Dom Under tour where we learnt more about the history of the city and saw some of the foundations from the past under the Dom square.


Zaanse Schans
Amsterdam
Originally the plan had been for me to go to Amsterdam with Jessica on the Thursday and Laura to go with Kai on the Friday, but as Laura wasn't feeling well I ended up going both days. We parked at Driebergen-Zeist station and got the train to Amsterdam.
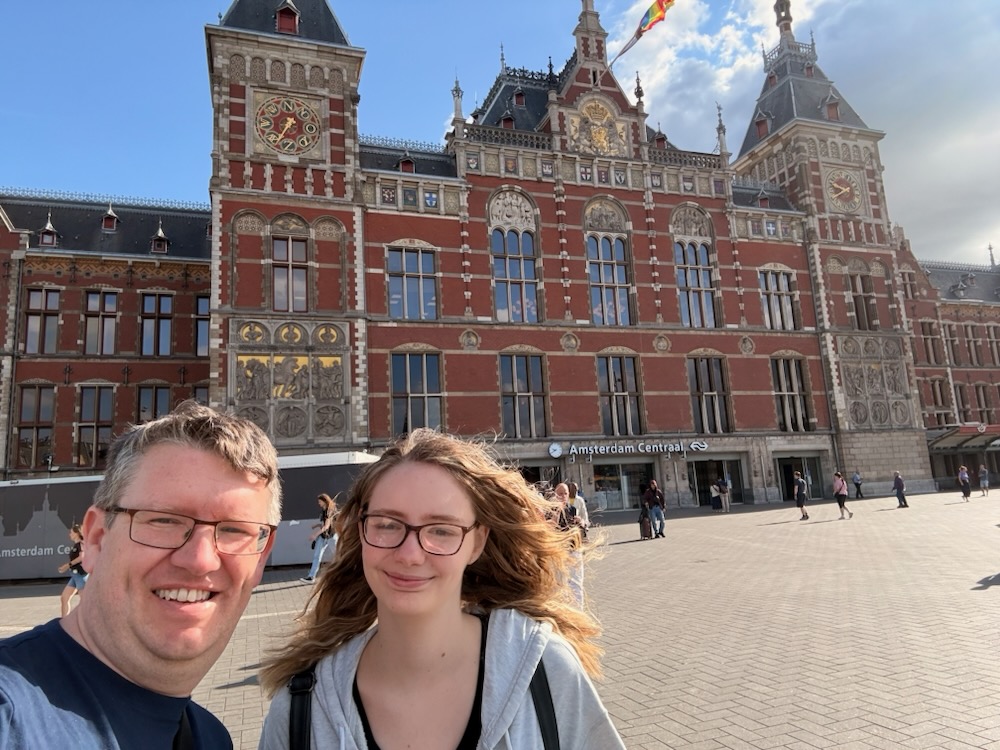


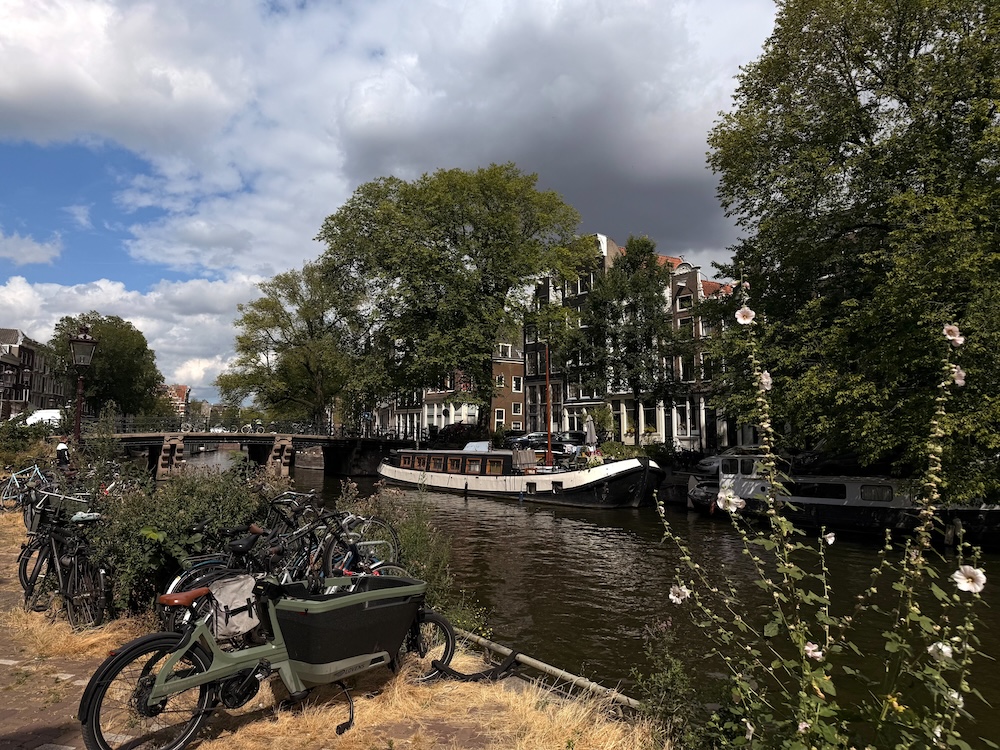
Each day we took a different route from the station through the city exploring the canals and catching a number of different sights throughout the route. With Jessica we headed south straight away - quickly finding we'd got there too early for a lot of the shops and cafes but were able to see the Royal Palace without any crowds on the square. We then headed to Negen Straatjes and on to the Vondelpark - a beautiful park with lots going on and space to sit, relax and enjoy watching things going on around. After this we went to take a look at the WorldPride Village but again we were too early for there to be much happening yet.
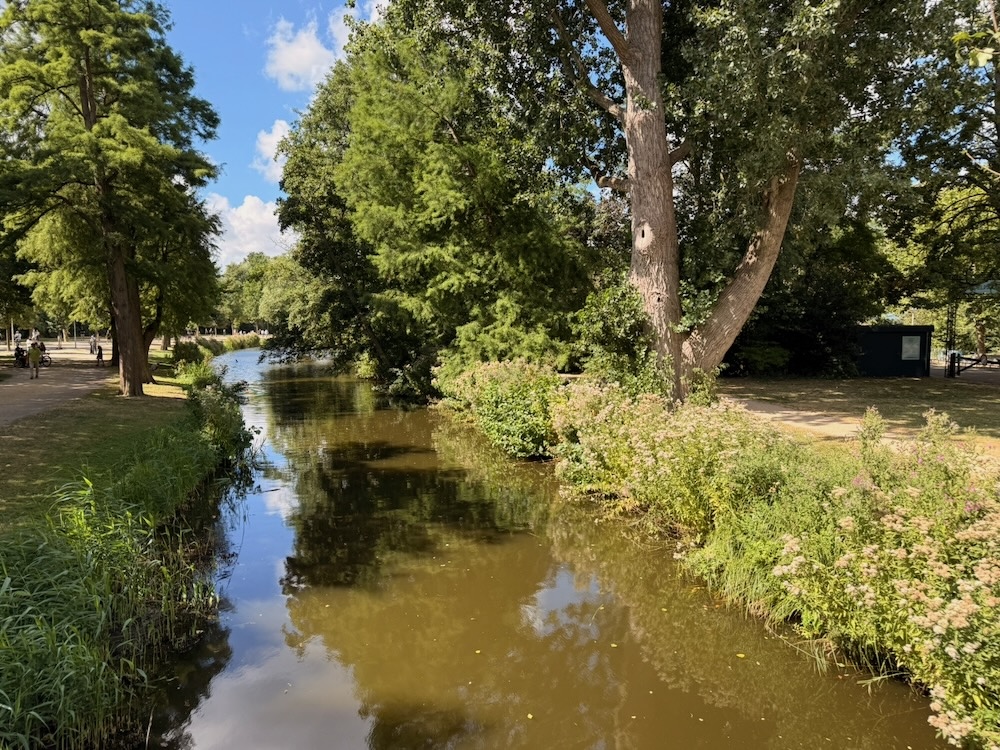
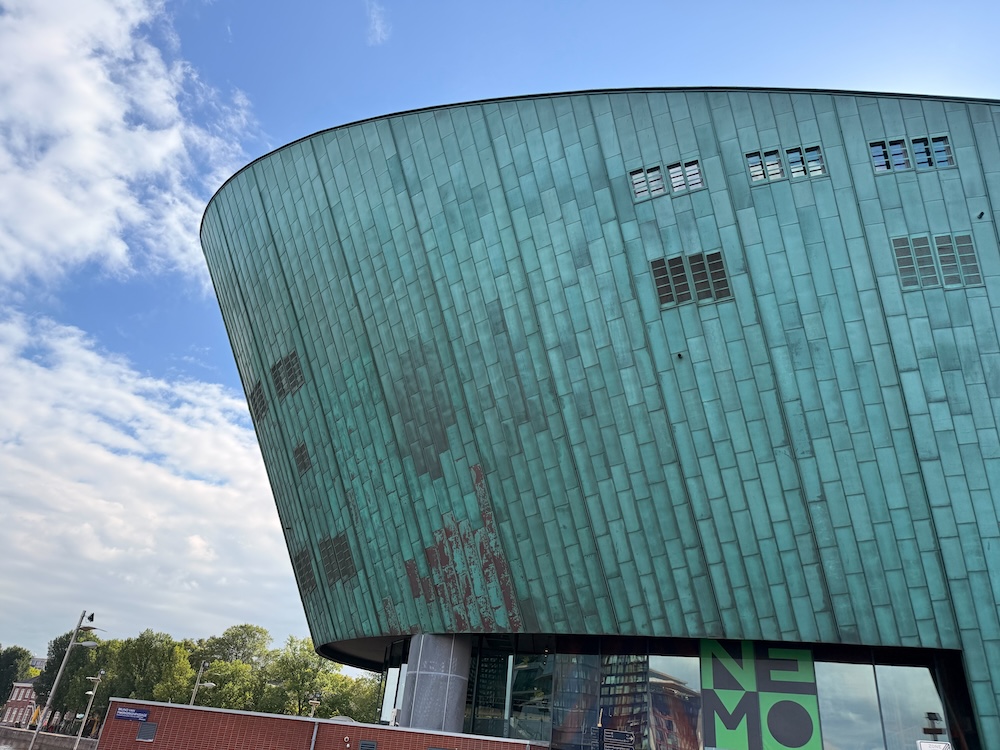
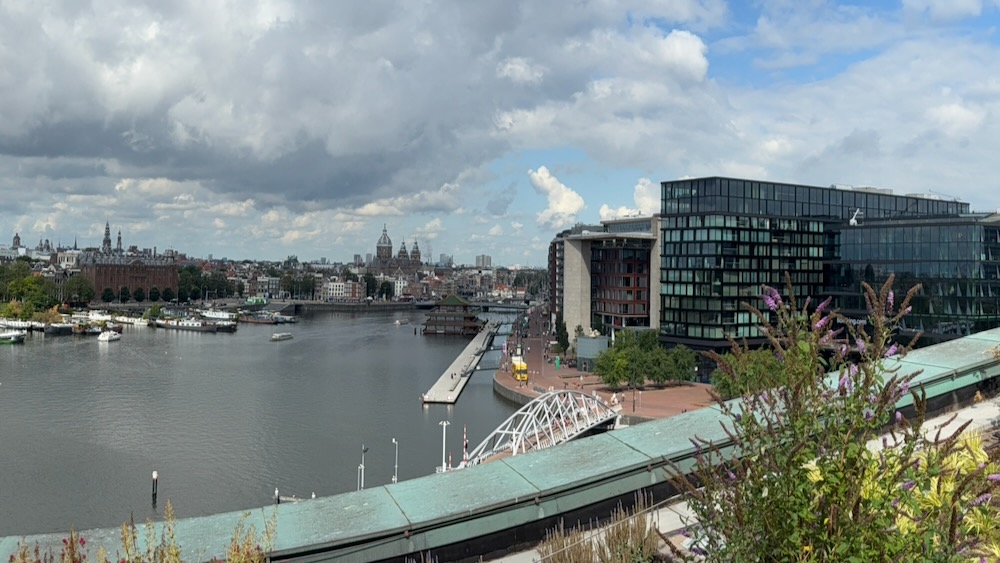
With Kai we started off heading across to Nemo and up onto its roof so we could see the views across the city, the steps were so wide that you had to take two paces on each one which made it quite a climb up but the views were well worth it. We then stopped for a drink at the cafe at the top before heading on to explore the city.
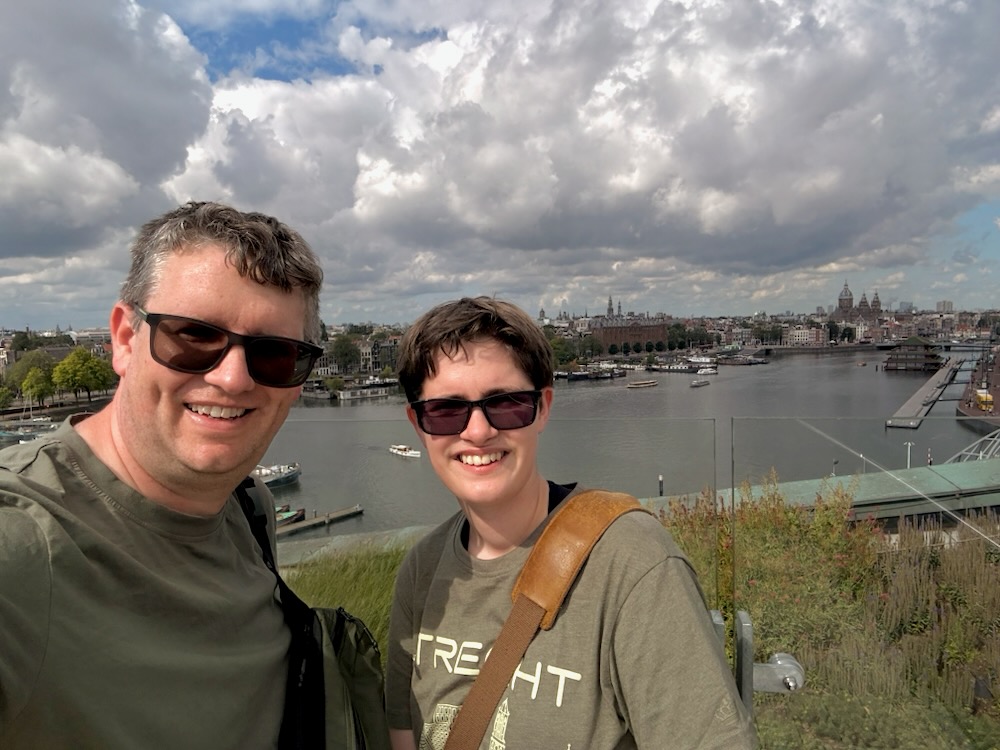
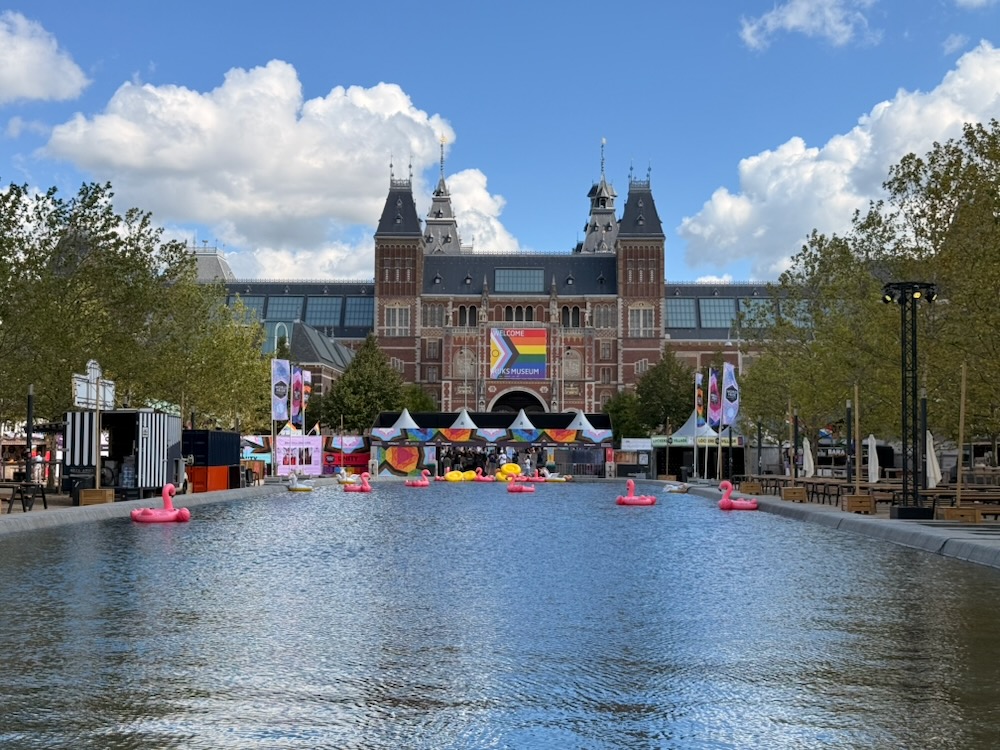
We then worked our way through the canals to find ourselves somewhere for lunch. Then after lunch we went to see the Royal Palace and the National Monument (much busier than they had been the day before). We then headed on round to Seven Bridges and round to Museumplein and the Van Gogh museum.


Kinderdijk
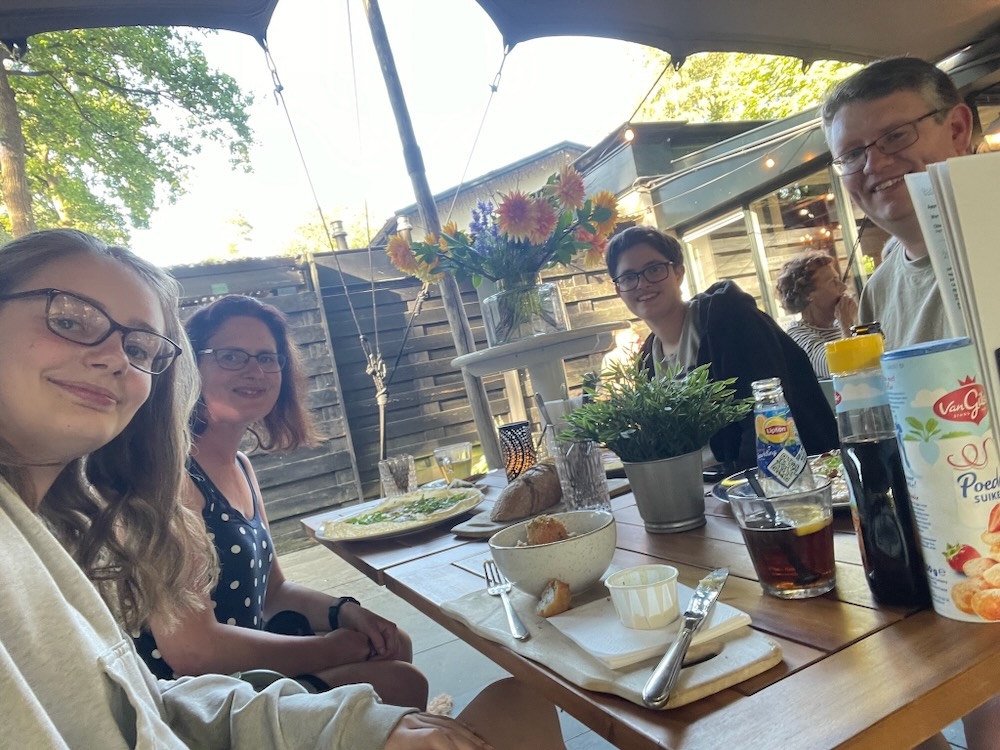
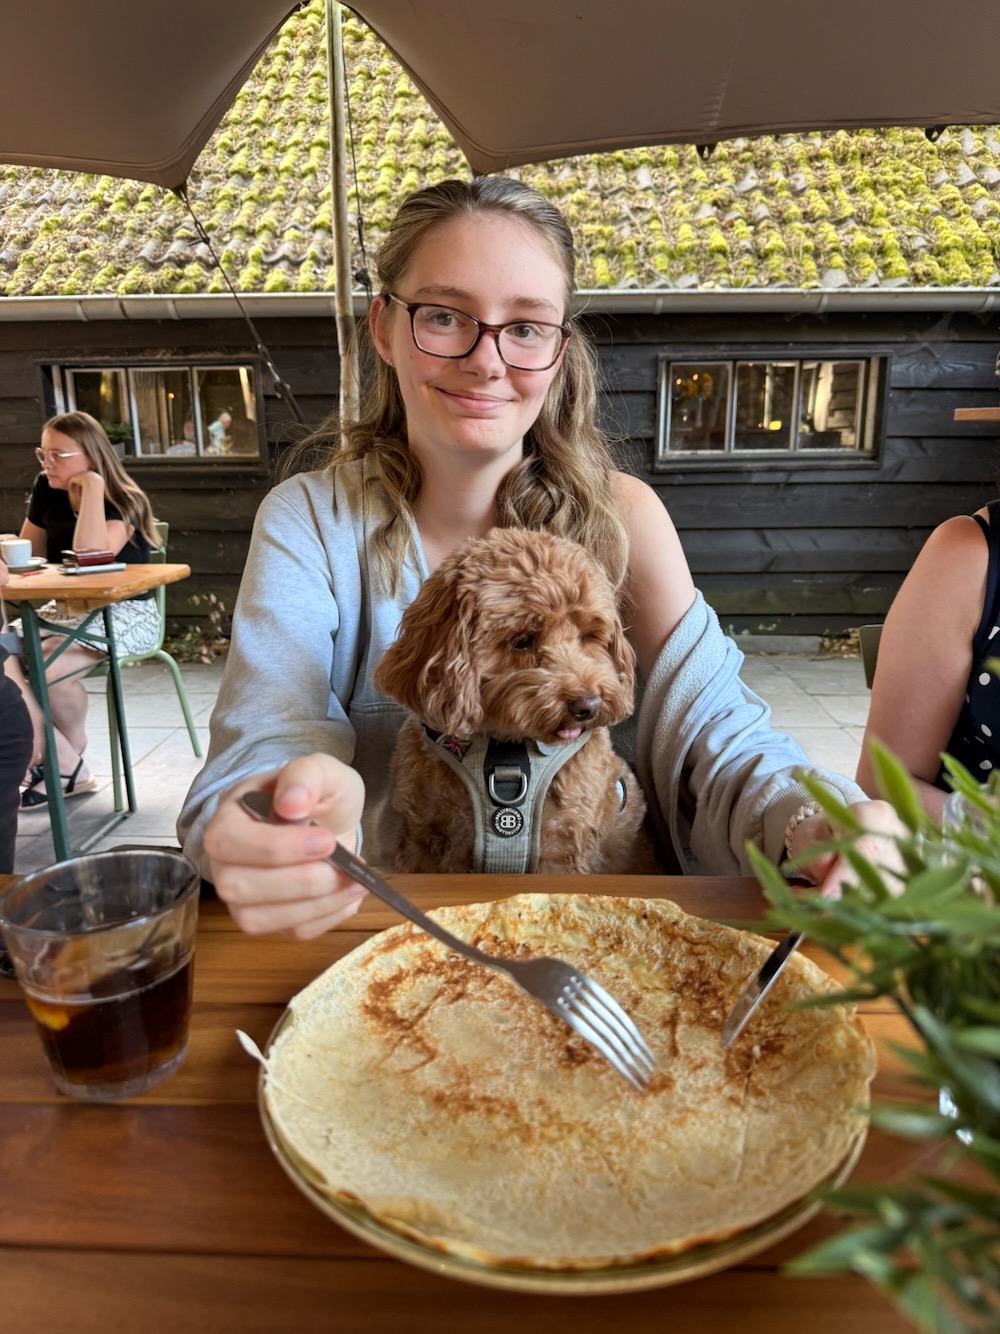
In the evening after our trip to Kinderdijk, we went out to have pancakes for dinner at Het Wapen van Sandenburg, followed by a walk in the forest enjoying the evening light.

Sunday 9th
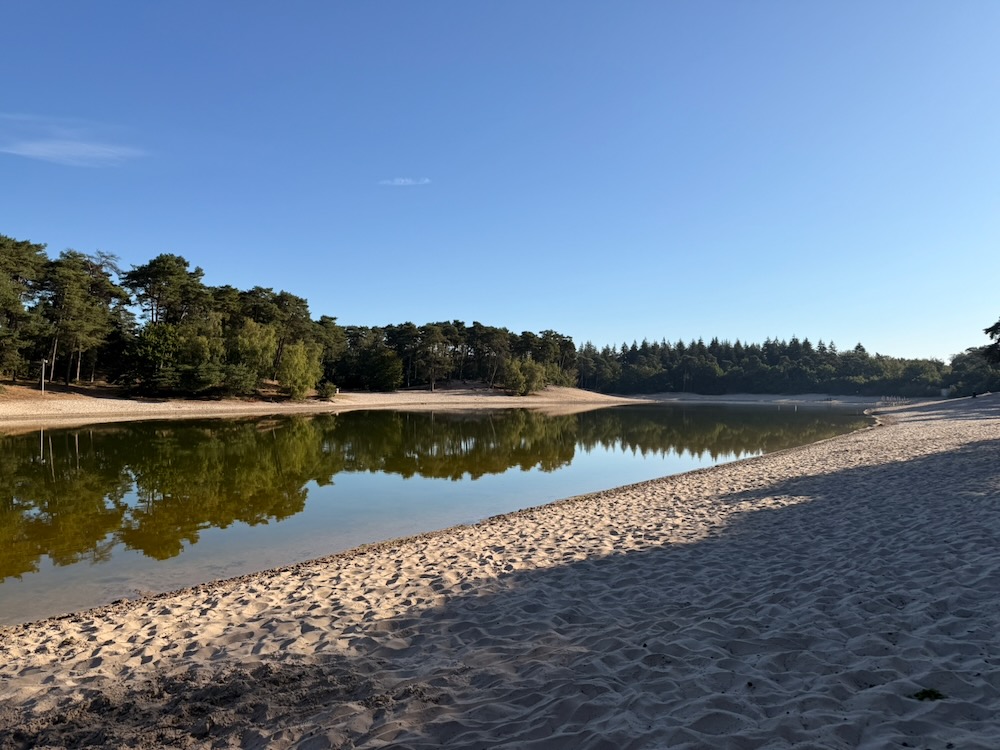
Henschotermeer is a lake surrounded by beaches that you can swim in - as dogs aren't allowed on site I took Kai and Jessica there to explore. As I didn't have my swimming things with me I just paddled but Kai swam. I wished I'd had my things as the water was a lovely temperature and it was a really nice location!

In the afternoon Laura, Kai and Jessica went to Huis Doorn - I dropped them off and then headed back with Nova - we took a scenic route and ended up on some seemingly quite narrow roads with water either side of them!
In the evening Laura and I went out to a local restaurant, Spott where we had a lovely evening. This was walking distance from where we were staying, had a fantastic atmosphere and we were well looked after by the friendly staff.
We had the High Wine menu which was amazing, and consisted of 3 different wines each served with a platter of food alongside. We started with a glass of Cava with fresh bread with olives and salad. Then there was a Portuguese Verdelho served alongside a seafood platter consisting of Oysters, Salmon, Tuna, Dutch Shrimp and Mackerel. We then finished with the Château Cavalier Rosé from Provence along with a hot platter including Nachos, Prawns and Bitterballen. The wines were exquisite and the food was delicious - really good value for money!
Monday 10th
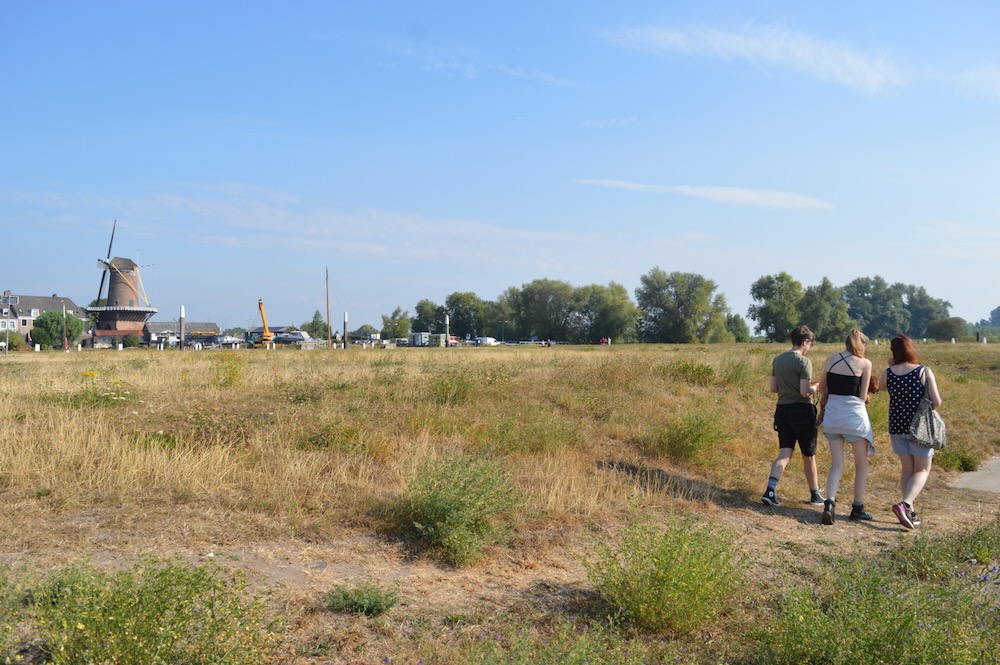
First thing we visited the nearby town of Wijk bij Duurstede where there is a mill and a castle on the banks of the Nederrijn (Lower Rhine). We went for a nice walk along the river to the castle and back along through the streets. We then headed back to the house to sort our things and to take Nova to the local vet for her required Tapeworm treatment so we would be allowed to return to the UK.


Tuesday 11th
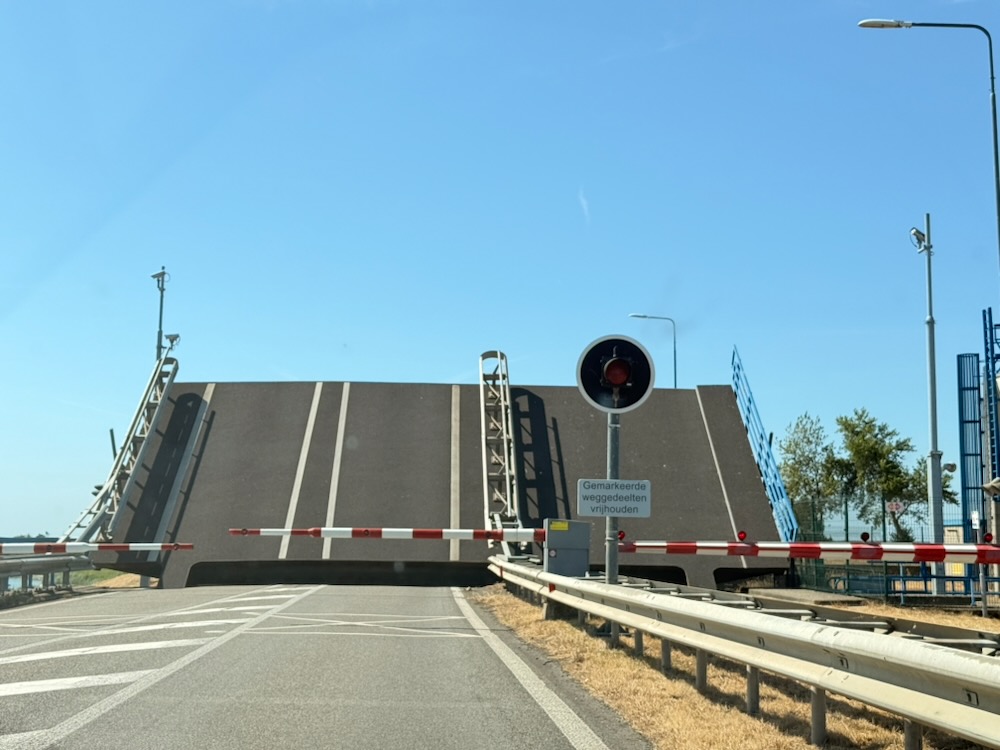
Our last day so we finished packing up, took Nova for a last wander around the local woods and set off on our way to Calais - taking a different route this time so we could see some of the sea defence dams on the way. We were fortunate to see one of the locks in operation with the road lifted up to let the boats past. We also stopped for a walk around Sluis to break the journey further which was a busy little town to visit, and lovely to explore around the fortifications.

GitOps Deployment of API Connect
As architect for the API Connect Cloud offerings one of the key areas I am involved in is deployment and in particular deployment automation. With my SRE background the main goal here is that anything we need to do more than once should be automated - deployment being a big one of these. Across our cloud environments - single-tenant and multi-tenant, IBM Cloud, AWS and Azure from dev through to production we probably have over 80 deployments of API Connect. These all use automation to deploy from declarative deployment models - in particular GitOps so our git repo is the source of truth for everything that gets deployed.
This is split into two primary areas - deployment of cloud services dependencies (Kubernetes clusters, object storage set up etc. ) and the application deployment itself.
Infrastructure - Terraform
For the cloud service deployments we use Terraform so we can declaratively describe the infrastructure requirements and have clean separation between the base template and the per environment configuration (region, size, ha-requirements) through variables. This all lives in git.
Application - ArgoCD
For everything that goes into kubernetes we use ArgoCD - which means all of the manifests for deployment live in our git repos and are watched by ArgoCD for changes. These are structured making use of ArgoCD's SyncWaves so that they are deployed in the right order and we know that the dependencies are in place before moving on. For example:
- -200 - Pre-requisites (cert-manager & issuers)
- -100 - Monitoring tooling
- 300 - API Connect CRDs and operators
- 400 - Management subsystem
- 500 - Analytics subsystem
- 600 - Developer portal
- 700 - Gateways
Just like in the old days of basic we've used multiples of 100 to allow us to add things in between later without reshuffling everything! In ArgoCD the default syncwave for anything without one specified is zero - so using negative waves for pre-reqs means we don't have to annotate all the CRDs and if we miss anything we know the pre-reqs are already there. In the manifests this would look like:
metadata:
  annotations:
    argocd.argoproj.io/sync-wave: "100"
This is a simplified overview, in our SaaS environments we add additional cloud specific components that handle tenant provisioning and ui based configuration addons which have their own waves in the deployments. We follow a similar pattern with the manifests that we do with the terraform - a base template and environment specific configuration. In this case we have used kustomize & helm based charts in different places as they both have distinct benefits for different use cases.
Use Kustomize when environments have significant differences. It uses a base template and overlays, making it much easier to follow what is actually happening compared to complex Helm syntax.
Use Helm when environments are identical except for minor elements (like hostnames). It uses values files to pass variables into charts, making it perfect for simple toggles (e.g., dev vs. prod).
In a repo the difference looks like this:
Kustomize
bases/
    management/
        management_cr.yaml
        kustomization.yaml
    gateway/
        gateway_cr.yaml
        kustomization.yaml
    overlays/
        dev/
            kustomization.yaml
            management-patch.yaml
            gateway-patch.yaml
        prod/
            kustomization.yaml
            management-patch.yaml
            gateway-patch.yaml
Helm
Chart.yaml
values.yaml
values-dev.yaml
values-prod.yaml
templates/
    management_cr.yaml
    gateway_cr.yaml
With Kustomize the bases/management/management_cr.yaml holds the common shape of the ManagementCluster CR and overlays/dev/management-patch.yaml only contains the fields that differ for that environment (endpoint hostnames, profiles, feature enablement). The patch only carries the fields that differ for this environment:
# overlays/prod/management-patch.yaml
apiVersion: management.apiconnect.ibm.com/v1beta1
kind: ManagementCluster
metadata:
  name: management
  namespace: apic-prod
spec:
  profile: n3xc4.m16
  endpoints:
    management: mgmt.prod.example.com
The overlays/dev/kustomization.yaml then pulls it all together:
apiVersion: kustomize.config.k8s.io/v1beta1
kind: Kustomization
resources:
  - ../../bases/management
  - ../../bases/gateway
patchesStrategicMerge:
  - management-patch.yaml
  - gateway-patch.yaml
With Helm the same effect comes from templating the differing fields in templates/management_cr.yaml and overriding them per environment in the values file:
# values-prod.yaml
management:
  profile: n3xc4.m16
  endpoints:
    management: mgmt.prod.example.com
We use Helm for our multi-tenant SaaS environments where the regional deployments need to be the same and Kustomize for single tenant deployments where we need to support more per-tenant differences.
Secrets
Everything that is not sensitive lives in the git repo - the secrets are then injected into the charts at deploy time from the relevant secrets manager for the cloud provider. These are abstract primarily through the use of ArgoCD Vault Plugin which supports a number of different secret backends.
This means our secret manifests have references rather than the actual secrets. For example the Secret we mount for the Management subsystem's DB credentials in prod looks like this:
apiVersion: v1
kind: Secret
metadata:
  name: mgmt-admin-pass
  namespace: apic
type: Opaque
stringData:
  password: <path:apiconnect/prod/management#db.password>
At sync time ArgoCD Vault Plugin resolves each <path:...#...> reference against the configured secret backend (IBM Cloud Secrets Manager, HashiCorp Vault, AWS Secrets Manager etc.) and rewrites the manifest with the literal values before it is applied to the cluster - the rendered manifest never lands in git, and the cluster ends up with a standard Secret that the operator can consume.
For customer owned secrets we've integrated External Secrets Operator to provide a similar abstraction at runtime.
Everything as code
A valuable technique I've found is treating everything I can as code - checked in, reviewed, and versioned. This post covers what that looks like across infrastructure, deployments, APIs, and even documentation, and why the discipline matters more than any specific tool.
What does "as code" mean?
By 'as code' I mean storing as a version controlled source of truth in a declarative form. This is distinct from building custom code as an automation in that what is being stored represents the desired state, not the steps to get there.
What can be treated as code?
- Infrastructure: defining the infrastructure components and configuration through a declarative language to be used with a tool such as Terraform to deploy and maintain state.
- Application deployments: for deployments to Kubernetes, you can use YAML manifests in a repository and then ArgoCD will keep the cluster in sync with what you have defined.
- API definitions: Store your OpenAPI specifications and gateway policy definitions in version control and use the API Connect toolkit to publish them to your gateway and developer portal - example with GitHub Actions. API Studio also makes it easy to work directly with your git repo.
- Governance rulesets: See also Git is your governance source of truth
- Process documentation & runbooks: Storing your documentation and runbooks as markdown in a repo gives you that built in change history and management rather than having to remember to update the changelog manually in the front of a word document.
- Diagrams: If you make use of a text based diagramming tool such as Mermaid, you can get these same benefits for your architecture diagrams making it easier to see over time how things have changed. Whilst you could also store draw.io diagrams in git and follow the changes, it is slightly less clear with its XML-based format.
Advantages
- Traceability — you know who made which changes.
- Currency — you know when it was last updated.
- Time travel — git history lets you revisit any prior state.
- Repeatable and Consistent — you can always instantiate from the declarative source
- Peer review via PRs — there is a built in system for proposing and reviewing changes
- Drift detection — you can see when your system diverges from the source
How this works in practice
This model is fundamental to how my team at IBM works. All our internal documentation and runbooks live as markdown files in git repos. For our cloud deployments the infrastructure is defined in Terraform, all the manifests are stored in git and deployed with ArgoCD. Having this consistency and repeatability is essential when you're maintaining over 80 stacks. We deploy a set of our own APIs to every stack using the toolkit. My next post will cover more detail on our deployments.
Pitfalls to watch
Whilst treating everything as code has its advantages there are a number of things to watch out for. You need to make sure you have a way to handle sensitive data separately and ideally scanning to avoid these being unintentionally leaked through your version control system. Not all data types work well in a system designed around text files, for example large or binary data that you can't easily compare changes in. This will balloon the repo size and start to make things painful for everyone using it. The review process can become tedious if not handled carefully - it needs to be thought through so that you get the benefit of peer review without it becoming a checkbox or a blocker.
Conclusion
The value in treating everything as code really comes from the mindset and the discipline around it, which is much more powerful than any specific tool. If you adopt this approach you get a common set of consistent practices across many different artifacts: traceability, review and a way to revert changes. In my next post I'll dig into how this is done in our API Connect cloud deployments.
Why Human Thinking Still Matters
Have you ever reached the end of the week and felt like you haven't had any time to actually complete anything you set out to do? We're building tools to save time but the resulting pressure to produce more and faster often leaves us with less time to think about why we are building anything. At the end of the day, computers are there to help us as humans. With APIs we build them for computer interactions, but with a clear aim of shared value to produce something useful for us; they're not an end in itself. The same should be the case with AI.

When the goal becomes AI integration itself however we risk shifting our focus from the human outcome (time-saving productivity) to the technological output. When this happens it feels like it doesn't matter how it's being used or where, but rather the usage itself is the goal. Wide claims of productivity gains from AI are leading to new expectations of how much can be achieved in a given time period resulting in more and more things being built without the time for thinking.
Thinking is the key part of the development process - refining and synthesizing ideas - this is way we grow through working through the different options and elements of the idea getting through this messy stage into a valuable refined idea. If we skip this and jump straight to the implementation we end up with so many things being built - some with no purpose, some without enough time to ensure they are sufficient quality. Others started and never completed because of a pivot to the latest technology trend.
AI doesn't look to be going away any time soon and it can bring some value and benefits if we are careful around how we make use of it. We need to approach it as any other tool with a clear purpose and strategy to reach our goals - using the AI to handle the "busy work" to reclaim that time for the valuable deep work. Focusing on using AI to solve problems that are tedious or complicated for humans to work on rather than to replace creative human thinking. AI shouldn't replace inter-human communication - I'd much prefer to read raw thoughts in a couple of paragraphs than a 4 page polished AI generated document that was built from that.
The goal isn't to build more, it's to build better. AI can help give us some of the speed but only if we clearly articulate the direction.
Machine-readable?
I've always been interested in ensuring my blog was readable to humans and machines - so over the years I've added and experimented with different ways to do this as what it means to be machine readable has changed. I currently have a range of these supported from embedded metadata to alternate versions that can be used with an LLM. Currently on this blog I am using the following:
- RSS Feed - my RSS feed
- JSON Feed (validator)- my json feed
- hentry (validator)
- TechArticle (validator)
- OpenGraph (validator)
- Alternate markdown version - this page in markdown
- standard.site (validator)
As I recently added the alternate markdown version and the standard.site integration here's some details on how:
Adding standard.site to my hugo static blog
Initially I started using Sequoia which is a great tool that can handle processing and posting documents from a static site and whilst it did a great job of processing and posting my content, I wanted a bit more control. In particular the way I handle featured images didn't fit with its model and I didn't want to inject links into the generated html - I wanted this as part of the main templates. Adding the meta tags to the template was straight forward - always including the publication reference and the document one where specified in the frontmatter.
Now the next thing to do was to find a new way to post the documents and obtain the did for the standard.site document. I came across this useful guide which gave me some good pointers on the basics through nodejs examples, but as I prefer to write scripts in python, I ported the ideas into my own script. Whilst building this I used pds.ls to check on the results.
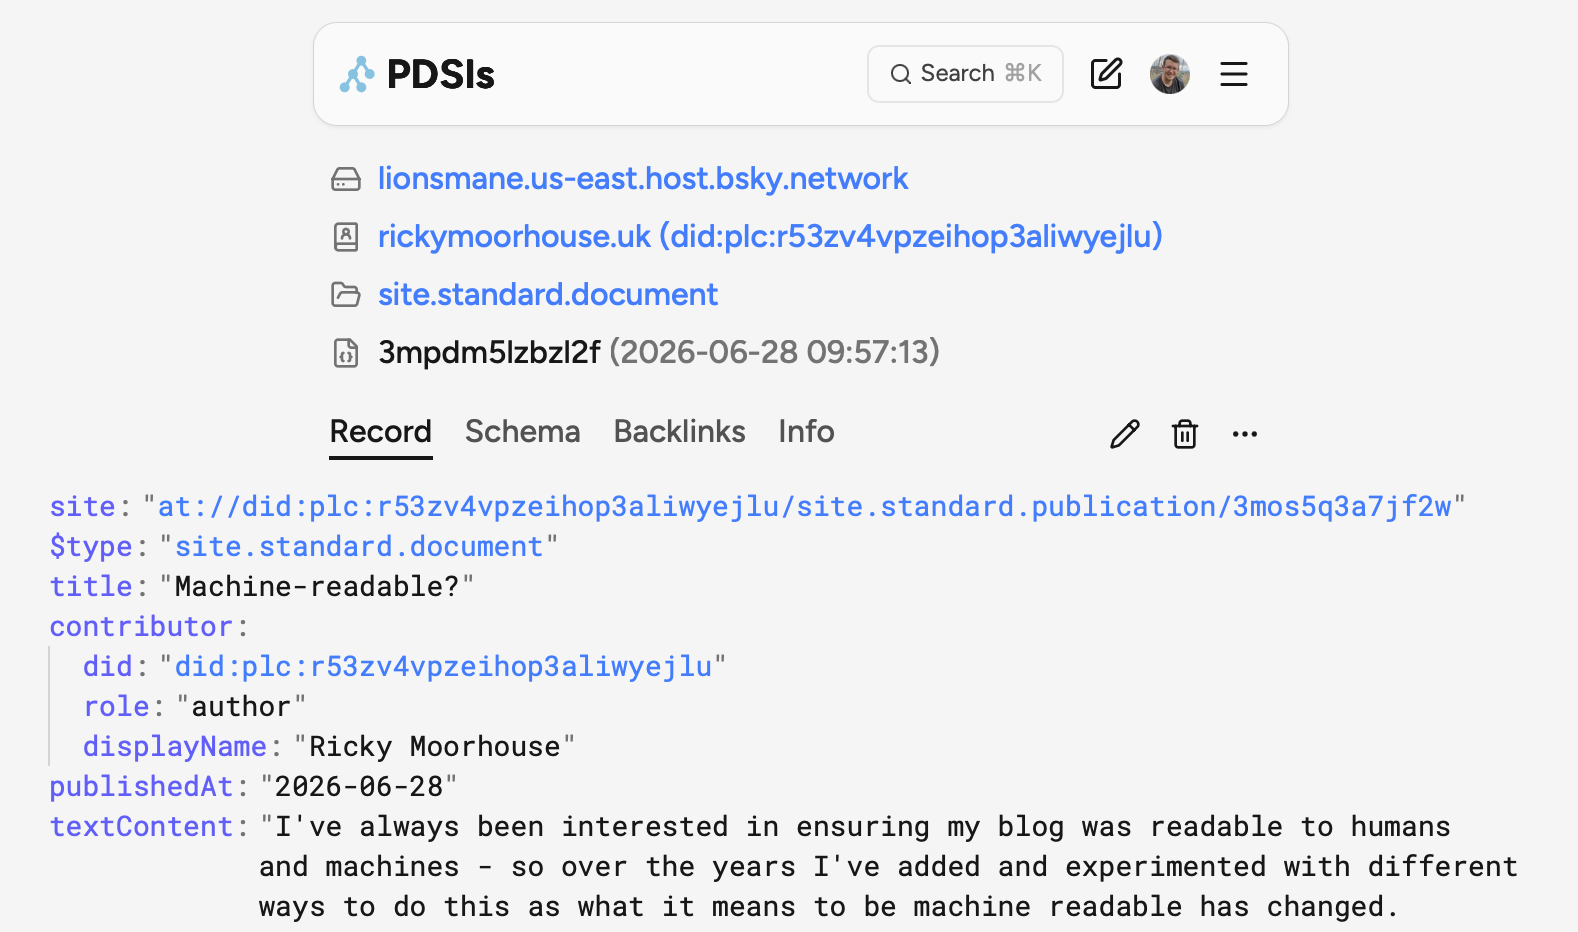
You can see my current script in github - this will either take in an md file as a parameter or identify one from the staged commit. The script then builds the standard.site.document lexicon content:
document_record = {
    '$type': 'site.standard.document',
    'site': blog_did,
    'title': post_data['frontmatter'].get('title', 'Untitled'),
    'publishedAt': post_data['frontmatter'].get('date'),
    'textContent': text_content,
    'canonicalUrl': post_url,
    'contributor': {
        'did': agent.me.did,
        'role': 'author',
        'displayName': "Ricky Moorhouse",
    }
}
# If there is a featured image, upload as blob and get the reference
if 'featured' in post_data['frontmatter']:
    featured_image = post_data['frontmatter']['featured']

    # get relative path to the post file, removing the file name
    post_path = post.rsplit('/', 1)[0]

    # Upload to atmosphere and get the blob reference
    blob_ref = upload_featured_image(agent, post_path, featured_image)
    document_record['cover'] = blob_ref
If I have an atUri already in the front-matter, the existing document is updated, otherwise a new one is published and adds the atUri to the front-matter. At the moment my workflow is to write the post, stage the commit and then run the script before updating the commit and pushing to GitHub where my actions will then publish the blog post, but eventually I plan to move the script to be run from the actions as part of the publishing. I'm also experimenting with using an LLM to generate a post for social media to link to the article.
Markdown versions of posts
As well as extending to push documents to atproto using the standard.site lexicon I've added markdown files for easier consumption by AI Agents - inspired by isitagentready. These files are generated through hugo as part of the publishing flow.
To add markdown versions of posts, I just added markdown as an output format, created .md versions of my page and home template and included metadata pointing to the alternate version in the header - you can see how in this commit.
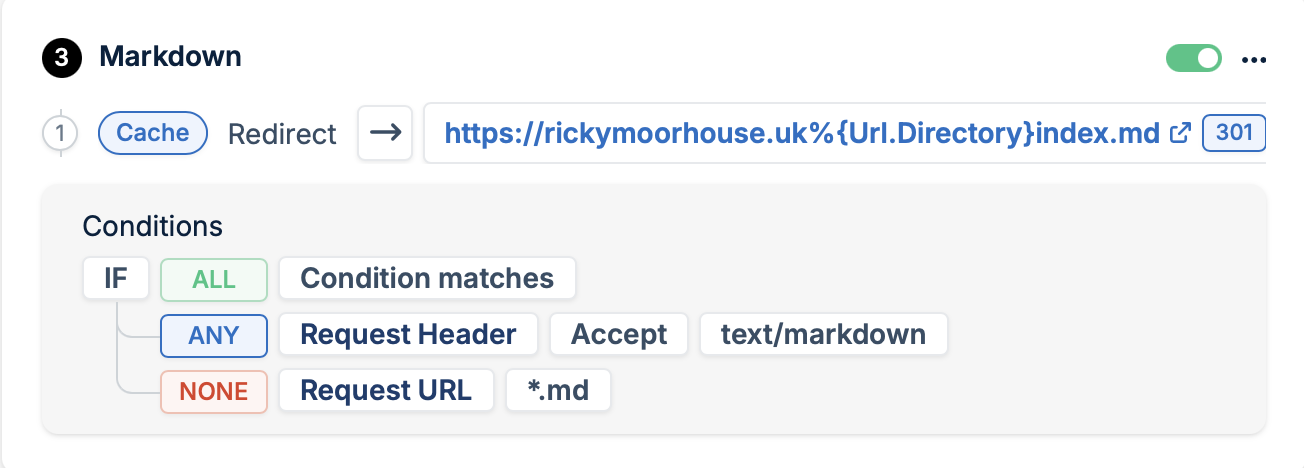
Once the files were being generated, I added a Bunny CDN Edge rule to handle content negotiation so that if content type of text/markdown is requested, then I redirect to the md file. This way the same URL can be used for reference and humans and agents will each get the most appropriate version.
MCP Ponderings
Agents are only as good as the access they have to accurate data and business functions. LLMs have a cut off point as to what they know - they're trained on a set of data and anything beyond that is unknown to them - therefore to build useful agents you need to provide a way for them to access data beyond that corpus. This could be more your own business data or just more recent information. To enable this Anthropic introduced Model Context Protocol (MCP) as an open standard to build these connections to data-sources and tooling. Since then, MCP has exploded into the most common way of providing tools to AI Agents.
There are 2 main types of MCP Server - local which you download and run on your machine (just like a CLI tool) and remote that you connect to through a URL (just like an API). They can both be configured and they both have their risks - so we need to consider how we safely manage these in our environment, building on how we control and manage APIs and software and APIs.
Local MCP Servers (stdio)
There are thousands of pre-built MCP servers out there to download and use - some official but mostly unofficial community built servers created by interested developers or their AI Agents. According to Equixly 43% of MCP servers contain command injection flaws and 30% permit unrestricted URL fetching, so it is important to understand what you are running. This highlights the fact that traditional security practices still apply to the agentic space - often more than ever. Supply chain security and least privilege are more critical than ever when you have non-deterministic agent flows handling data through community tooling.
Often these are documented with a single command to download and run that you add to your agent config - using npx or uvx, however you can usually still download, build and run in the traditional way you would opensource projects to ensure you stick to the version you have verified. This way you have a level of control over the tools you are using but would still need to be sure to keep dependencies up to date.
Remote MCP Servers (streamable-http / sse)
In a lot of ways use of a remote MCP server is very similar to using a third-party API as part of your application, in fact some places I've seen MCP tools provided where there wasn't previously even an API or access to the MCP be made easier than it was previously to get access to the API. There are however some key differences:
As Agents connect to MCP servers they will initialise a session and list the tools available with their specifications dynamically as a kind of discovery each session which is loaded into the agent context. The ensures they always have the latest tool definitions, can adapt accordingly and don't need to review a separate spec or changelog if the tooling is updated.
As they are being used in a non-deterministic process, you don't know up front what your agent will be sending them. For example agents build the tool call based on their language model, your input and the tool specification without formal object declarations, so it is all open to interpretation which may lead to unexpected sequences of tools or needing to retry to get parameter formats correct. Whilst APIs would typically define input types using json schema, MCP defines tools with textual descriptions. One example I've seen was with timestamp formats where the backend the tool interacted with was expecting ISO8601 format but the agent was trying to use relative times.
Security checklist for MCP
Ultimately, the responsibility for the security and integrity of these systems remains entirely with the user. Because agentic flows are non-deterministic the risk of an unintended action, triggered by a flawed community tool or a prompt injection, is higher than in traditional software.
- Audit the tooling - whether this is the source code downloaded or the provider of the hosted server - before you connect you should ensure you can trust it with your data.
- Isolate downloaded tools to limit the risk of command injection, for example running the MCP server within a Docker container controlling what they can access. For remote MCP servers, routing calls through a gateway gives similar control to restrict, observe and adjust interactions as needed.
- Credentials - Use dedicated credentials for MCP tooling that can be revoked, and apply the principle of least-privilege so they only have permissions they need.
- Approvals - Ensure that sensitive actions require a human approval.
- Review that the tools continue to work as you intended them to.
Securing Sensitive Payload Logging in API Connect
Unintentionally logging sensitive customer data (PII, financial info) is a major compliance risk. When deploying APIs, ensuring that this data is kept out of your logs requires robust, layered controls. Whilst developing APIs that will deal with this sensitive content you will often need to see what is being passed to ensure that everything is being handled as expected. Very often in a development or test environment you will be using a dummy payload to ensure the API is working as expected so it is key to ensure it is reflected at the different stages of processing as part of your test suites.
When you progress to partner integration testing with an API you are no longer as in control of the payload passed in through the client, so at this point become dependent on payload logging to see what is being passed and processed. At this point as we would still be dealing with dummy data this would be acceptable in most cases.
Once the API use progresses towards production and real sensitive data is being transferred you need safeguards in place to ensure the data is no longer being logged. Of course data security requires a layered approach and this article only covers one area of this - payload controls. This needs to be paired with additional strong security controls such as ensuring there is encryption in transit and at rest across your system and sensitive data isn't being transmitted in the query string which could be logged by other network components (owasp ref).
In API Connect there are several features that can be used to assist with this and the combination to use will be different depending on your specific requirements. Depending on your goal will determine which one is most appropriate in your scenario:
- To see the data in lower environments to assist in development, make use of full payload activity logging
- Protect specific fields in logs using redaction policies
- Ensure compliance standards are met across the board make use of Governance Rulesets
- To prevent any logging of certain data globally, make use of analytics Filters
Let's examine each of these features in turn:
Activity Log settings
The default behaviour in API Connect is to log activity for all APIs and only log payload (request and response body) on error - but this can be customised on a per-API basis. For the DataPower API Gateway, this is configured in the activity-log extension and the options are payload, activity, headers or none and in the yaml it looks something like this:
activity-log:
  success-content: headers
  error-content: headers
  enabled: true
This could also be configured to reference Catalog properties so that you make these settings at a catalog level and all the APIs reference this with syntax like $(catalog-error-content) in your api definition.
Redaction policy for field level controls
If you don't want to restrict the entire body of the API and it is specific known fields that contain sensitive data, you can use the redaction policy to remove or replace these fields with asterisks. The policy uses JSONata to identify the fields to modify. For this you need to first use the log policy in gather-only mode in order to modify the logging. The gather-only mode in the log policy is crucial because it instructs the policy to collect the full, sensitive payload and place it into the internal log context object. This allows the subsequent redact policy to operate on the logging data itself, prior to it being written to analytics, ensuring the client receives an unmodified response while the sensitive data is masked in the logs.
- log:
  title: Gather log to redact
  version: 2.0.0
  mode: gather-only
- redact:
    version: 2.0.0
    title: redact birthday in the logged data
    redactions:
      - action: redact
        path: $.**.birthday"
    root: log.response_body
Whilst this can also be used to remove or redact the full body it is more typically used on individual fields as adding a policy to each API when you can just set the activity log level is mostly overkill.
Governance rulesets to check
Whichever approach you take, you can make use of governance rulesets to ensure that all APIs meet your standards - these can be used in a CI CD pipeline for checking the status before publish or even configured on a catalog to block publish if the rules aren't met. Governance within API Connect supports the use of spectral rulesets to scan API specifications at development time, through CI/CD pipelines and in periodic catalog scans.
extends: spectral:oas

rules:
  # Ensure activity-log.success-content is header
  activity-log-success-content-header:
    description: "activity-log.success-content must be set to 'header'"
    message: "activity-log.success-content must be 'header'"
    severity: error
    given: $.x-ibm-configuration.activity-log
    then:
      field: success-content
      function: pattern
      functionOptions:
        match: "^header$"

  # Ensure activity-log.error-content is header
  activity-log-error-content-header:
    description: "activity-log.error-content must be set to 'header'"
    message: "activity-log.error-content must be 'header'"
    severity: error
    given: $.x-ibm-configuration.activity-log
    then:
      field: error-content
      function: pattern
      functionOptions:
        match: "^header$"
Analytics filters
If you need to ensure these are never logged in the whole API Connect deployment you can set up filters in the Analytics Cluster configuration. There are two settings here one for storage and one for offload.
spec:
  ...
  ingestion:
    ...
    filter: |
      mutate {
        remove_field => ["response_body"]
      }
Navigating payload security in API Connect is not about choosing one feature; it's about implementing a defense-in-depth strategy. Start with foundational security (encryption in transit and at rest). Then, apply appropriate Activity Log configuration to get appropriate visibility at each stage. Where you need more fine-grained control, use Redaction Policies to target specific fields.
To continuously validate your configurations meet your compliance requirements make use of governance rulesets in CI/CD and finally, use Analytics Filters as a system-wide preventative guardrail. By stacking these tools appropriately you move from merely tracking data to actively securing it throughout its entire lifecycle.
Cheriton Circular
Distance: 5km
Lovely way to spend the bank holiday on a circular walk around Cheriton. The route picks up a section of the Itchen Way around Cheriton, joining it into a circular walk with paths around the surrounding fields with gorgeous views across the landscape.
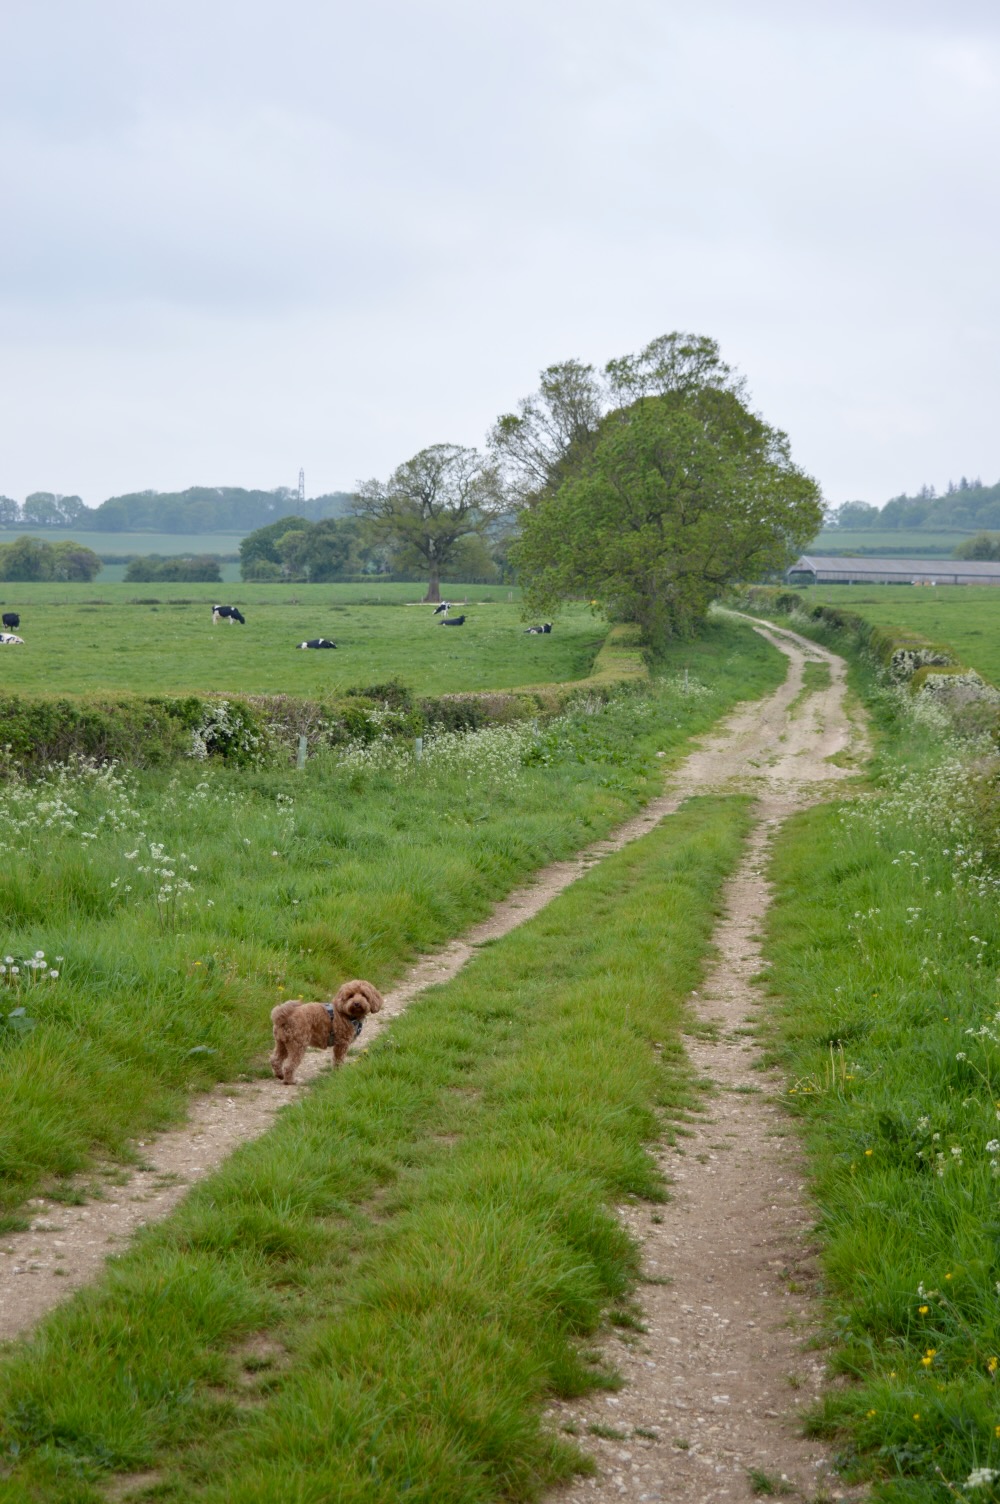
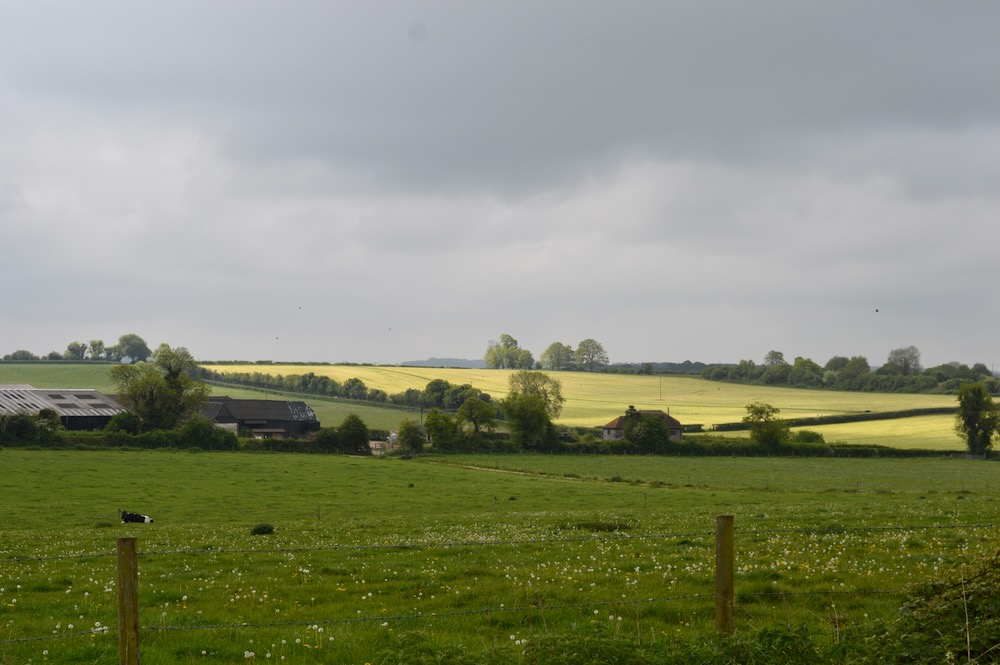
We parked near the village store in the centre of Cheriton and started off along School Lane until we saw the footpath signs to head off along the path between two fields - this was initially quite enclosed and narrow, but soon we turned right onto a wider path along the edge of the field. We continued along this path until we reached Broad Lane where we headed up to where it and Hinton lane joined. We followed Hinton lane up further to Prite lane where there were lovely views across the fields and down into the town.
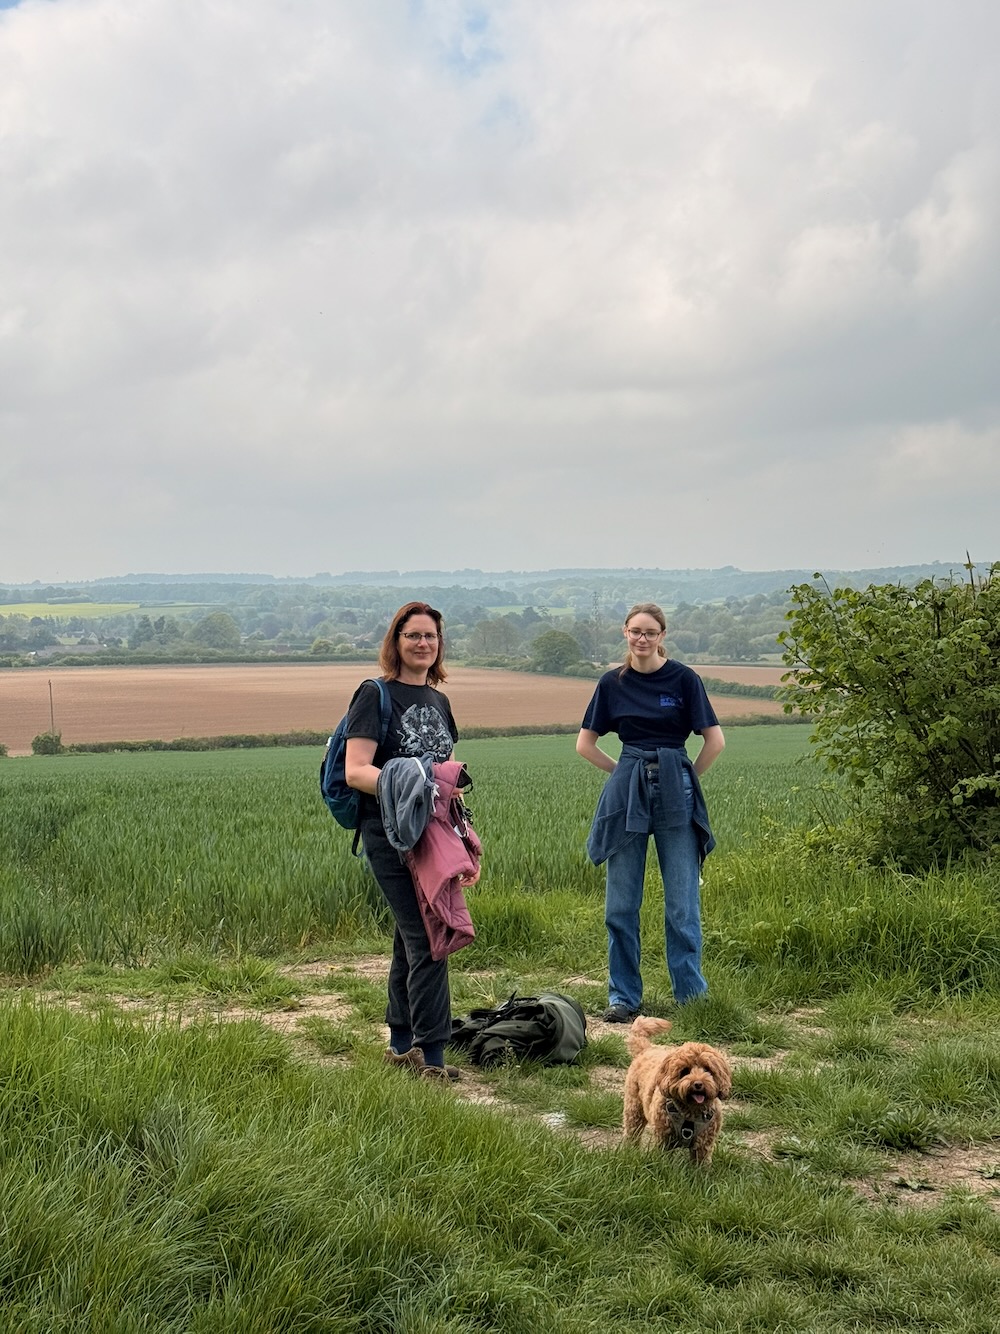

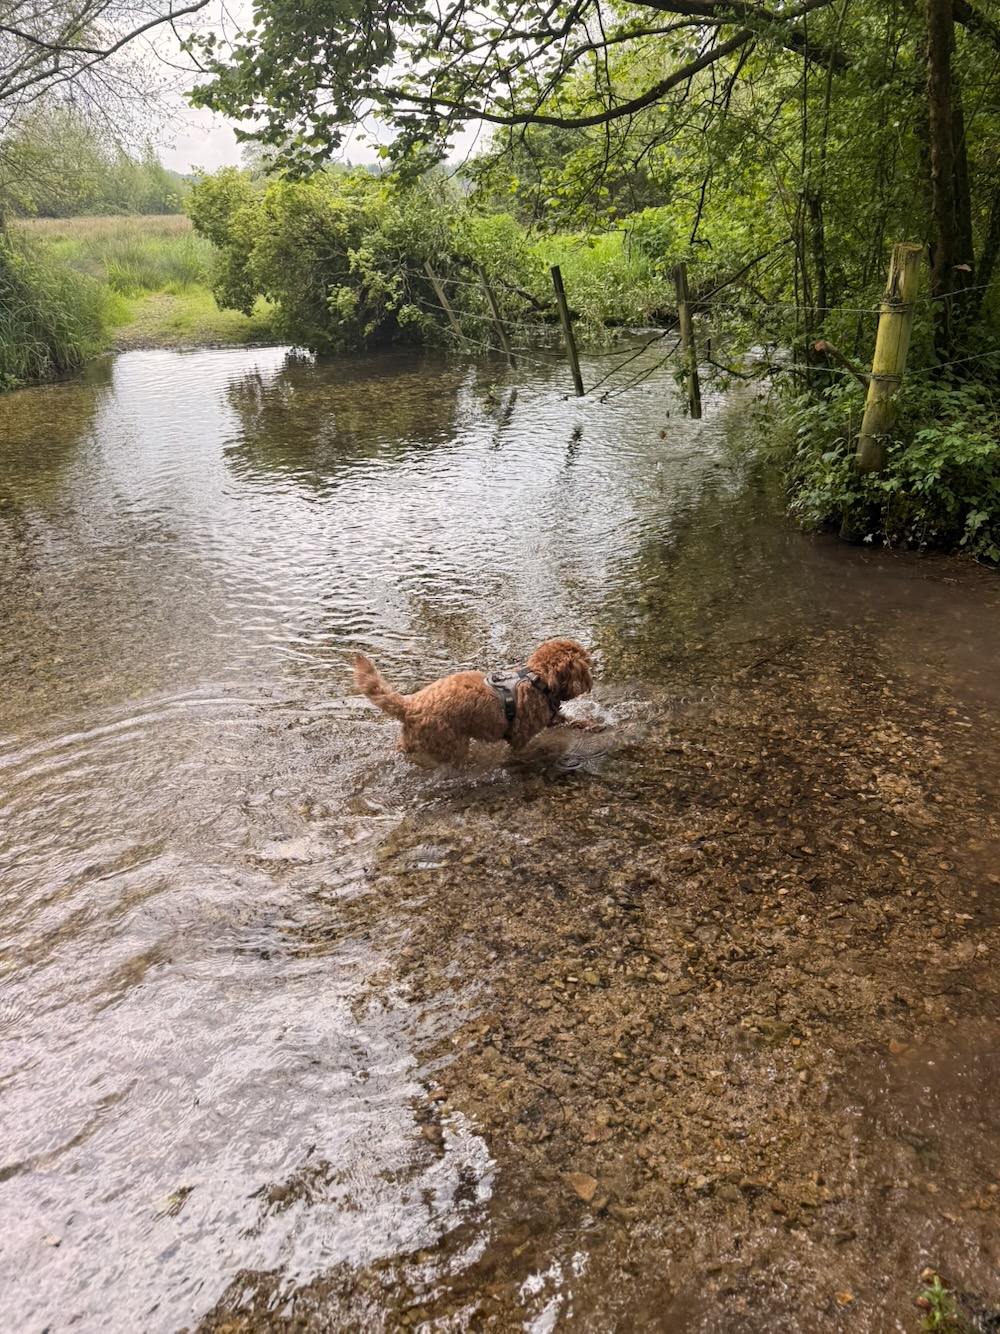
We headed down Prite lane across the bridge to the Old Mill where we were greeted with the sounds and sights of the River Itchen again. This is where we rejoined the Itchen way along the river past the mill. Further along the river there was a lovely spot that was ideal for Nova to have a nice paddle and play in the water.